Economic Tracker Dashboard
Problem Statement
How unevenly did the pandemic hit local economies - and how uneven is the recovery? This Streamlit dashboard uses Opportunity Insights data to track employment, consumer spending, job postings, and unemployment claims across U.S. counties in near real-time, all indexed to a January 2020 baseline.
Methodology
Data Sources & Architecture
The dashboard fetches data at runtime from the Opportunity Insights GitHub repository, with a 24-hour cache for fast subsequent loads. Each dataset page features an interactive Plotly county-level map and multi-county time-series comparison. The dashboard integrates the following datasets:
- Consumer Spending: Aggregated and anonymized purchase data from consumer credit and debit card spending (Affinity Solutions)
- Employment: Number of active employees, aggregating information from multiple data providers, broken down by wage quartile (Paychex, Intuit)
- Job Postings: Weekly count of new job postings, sourced from over 40,000 online job boards (Lightcast)
- Unemployment Claims: Weekly unemployment insurance claims counts and rates as a share of the 2019 labor force (U.S. Department of Labor)
- Student Progress: Student engagement and badges earned in online math coursework (Zearn)
All metrics except unemployment claims represent percentage change from a January 2020 pre-COVID baseline. The dashboard uses Plotly scatter maps on a Carto Positron tileset for county-level geographic visualization, with no external API keys required.
Results
COVID-Era Economic Recovery
Employment Recovery by Wage Quartile
Key Findings
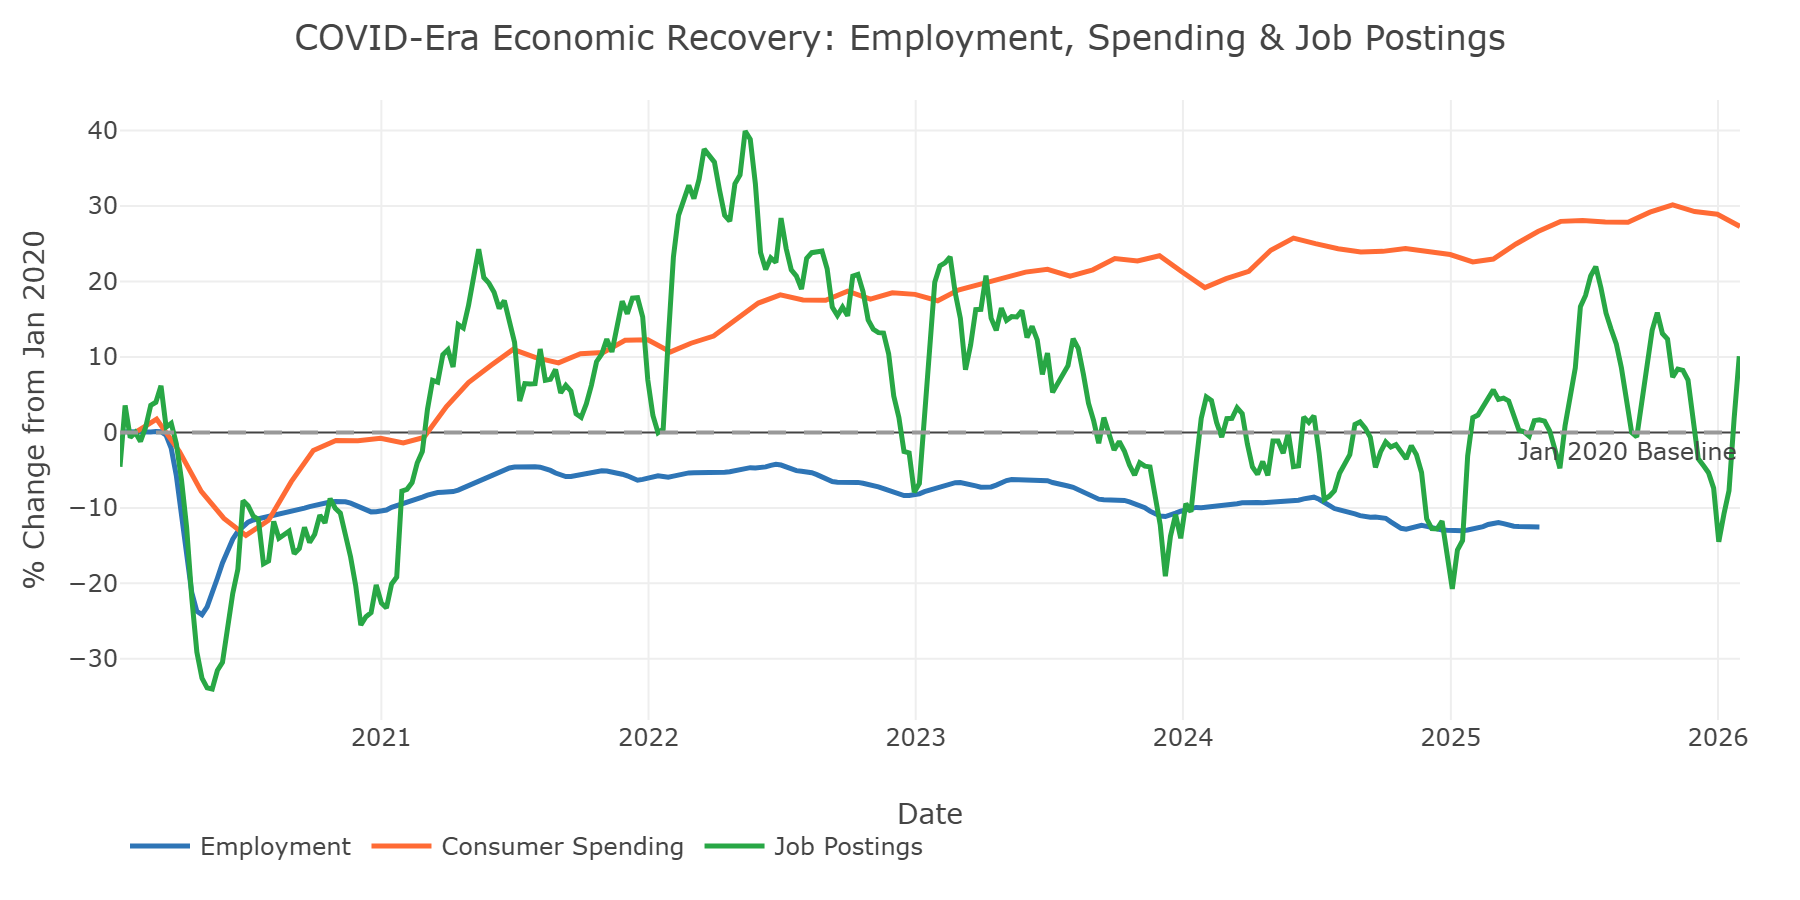
- Consumer spending has fully recovered and then some, running roughly +25% above January 2020 levels
- Job postings sit about +5% above pre-pandemic levels, suggesting healthy labor demand
- Employment remains about -13% below its January 2020 baseline - the starkest finding
- Unemployment claims spiked to 3.73 per 100 workers at the pandemic peak but have normalized to ~0.15
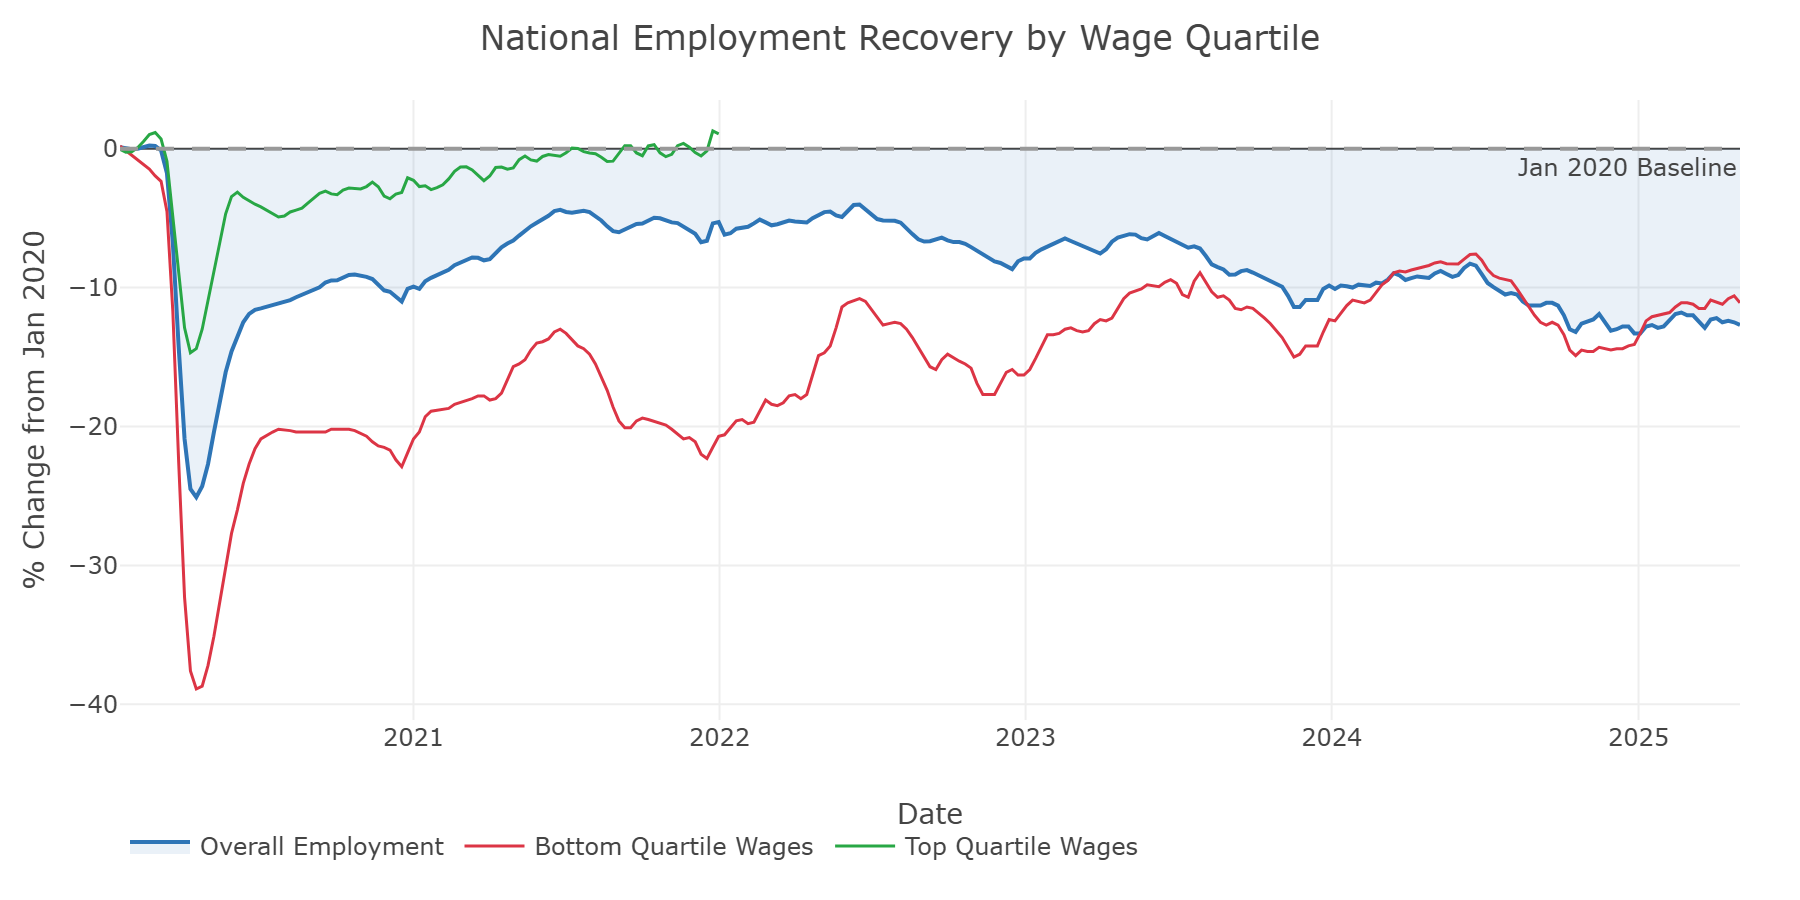
- Bottom-quartile workers consistently trail the overall employment recovery average