Retail Trade Time Series Forecasting

Problem Statement
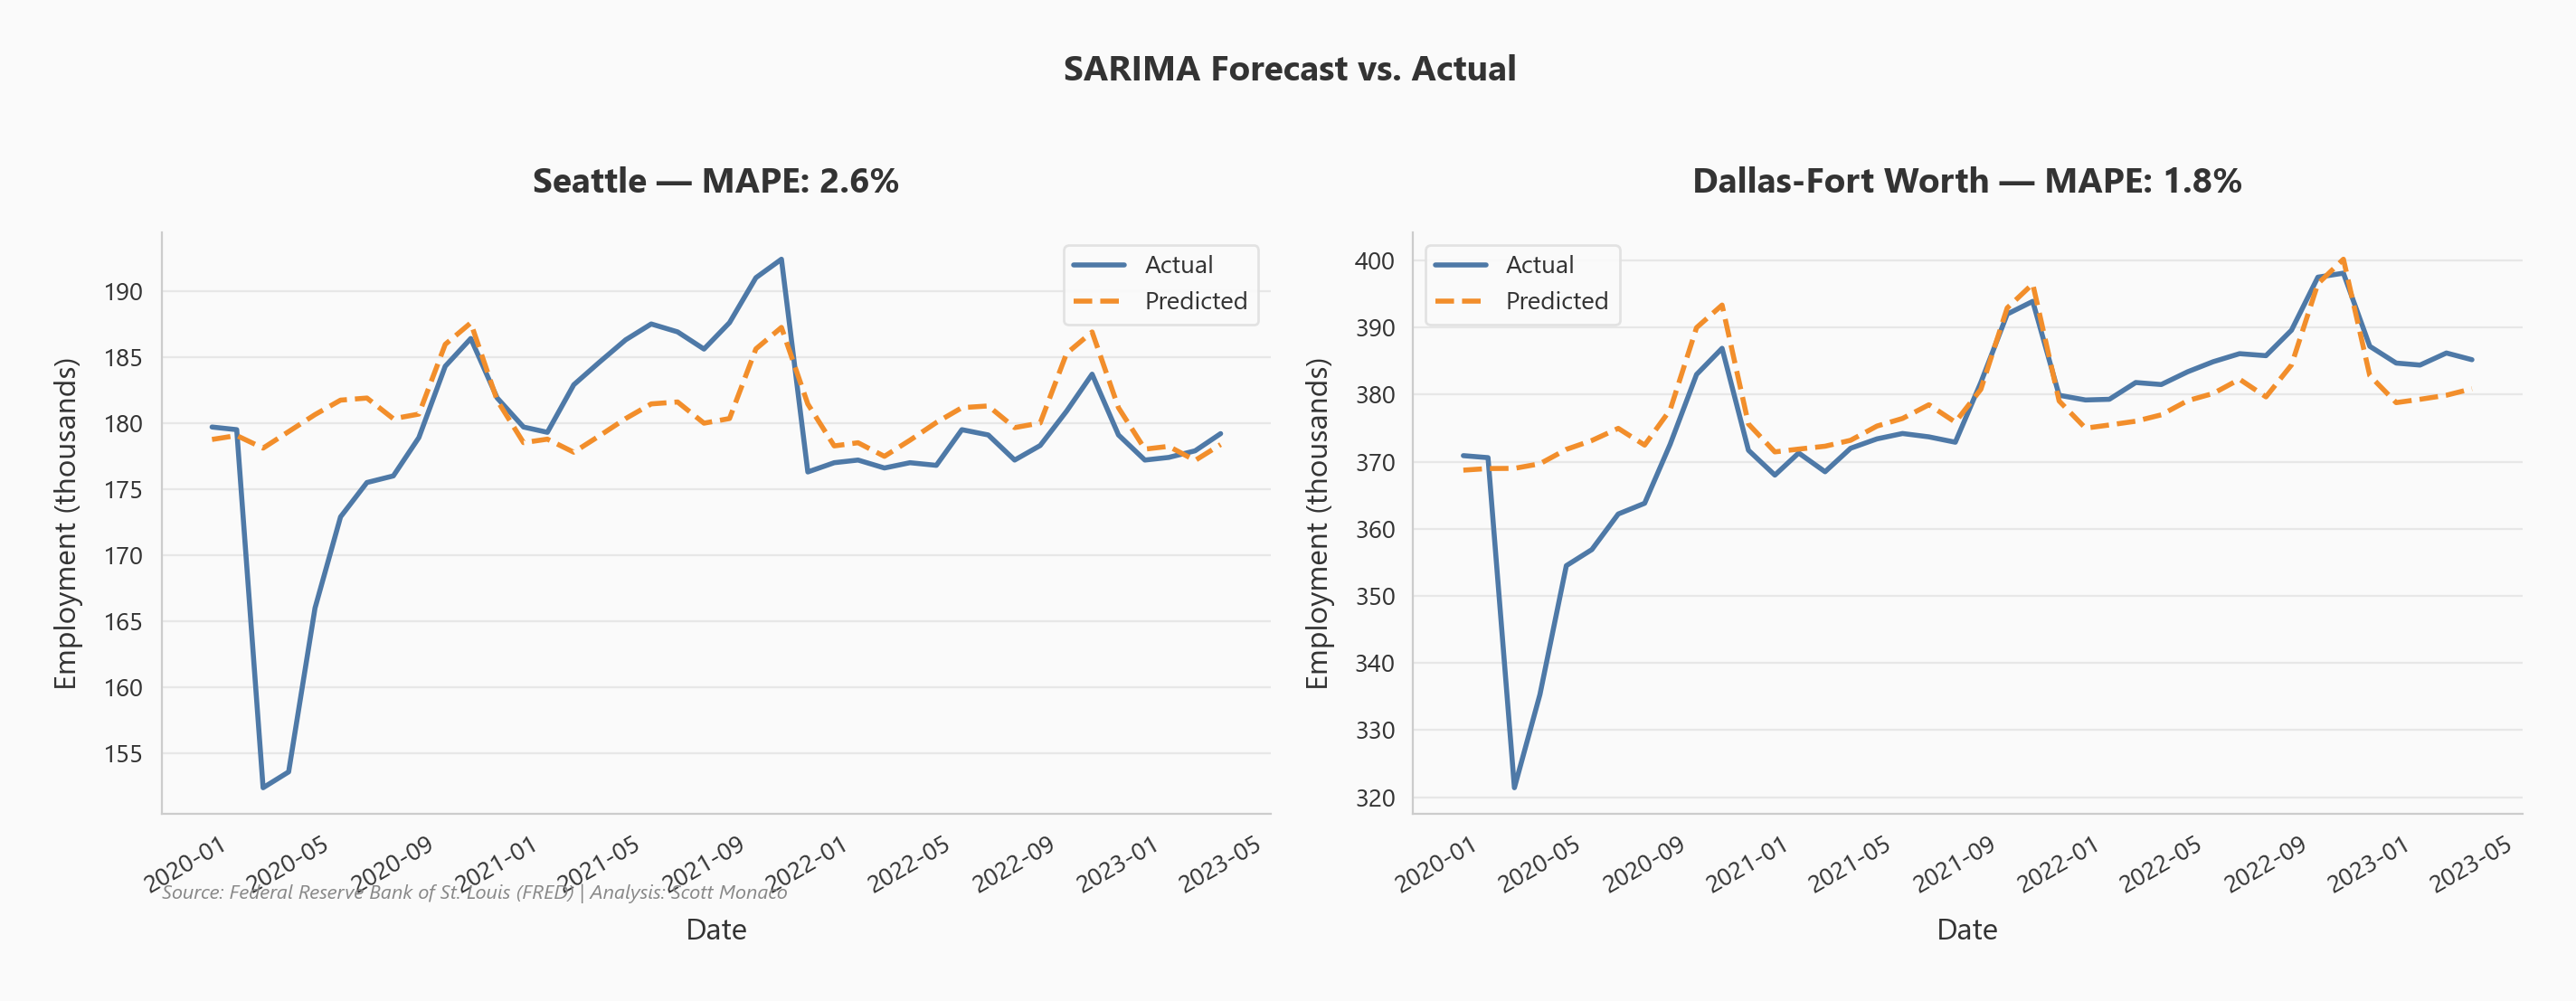
Retail trade volumes are deeply seasonal and trend-driven - making them a natural fit for time series forecasting. This project builds SARIMA models for two structurally different metro areas to predict monthly retail trade employment, using data from the St. Louis Fed (FRED).
The two regions - Seattle-Tacoma-Bellevue and Dallas-Fort Worth-Arlington - were chosen for their contrasting economic profiles: tech-heavy Pacific Northwest vs. diversified Sun Belt.
Methodology
Seasonality Detection
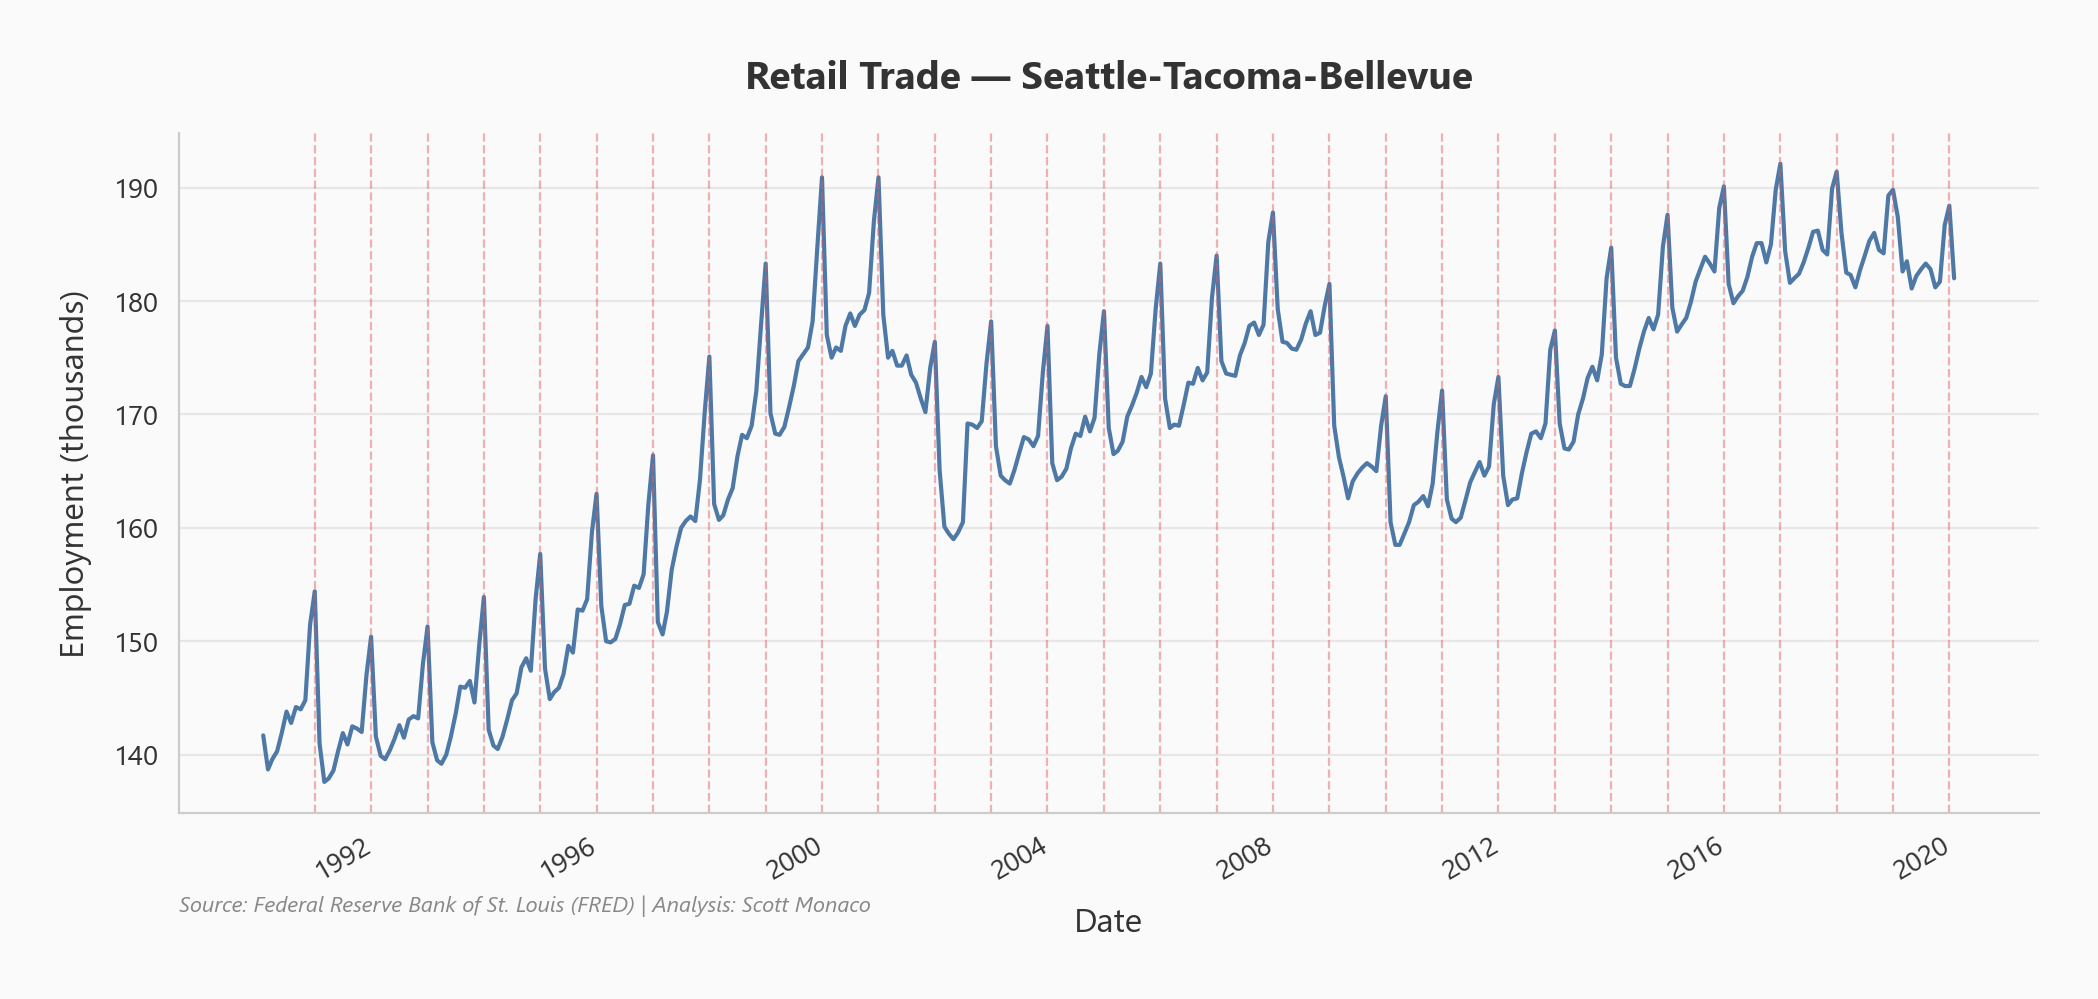
Examining the retail trade data reveals a clear repeating pattern every 12 months, as indicated by the vertical lines. Additionally, there is an upward trend, suggesting the series is non-stationary.
Achieving Stationarity
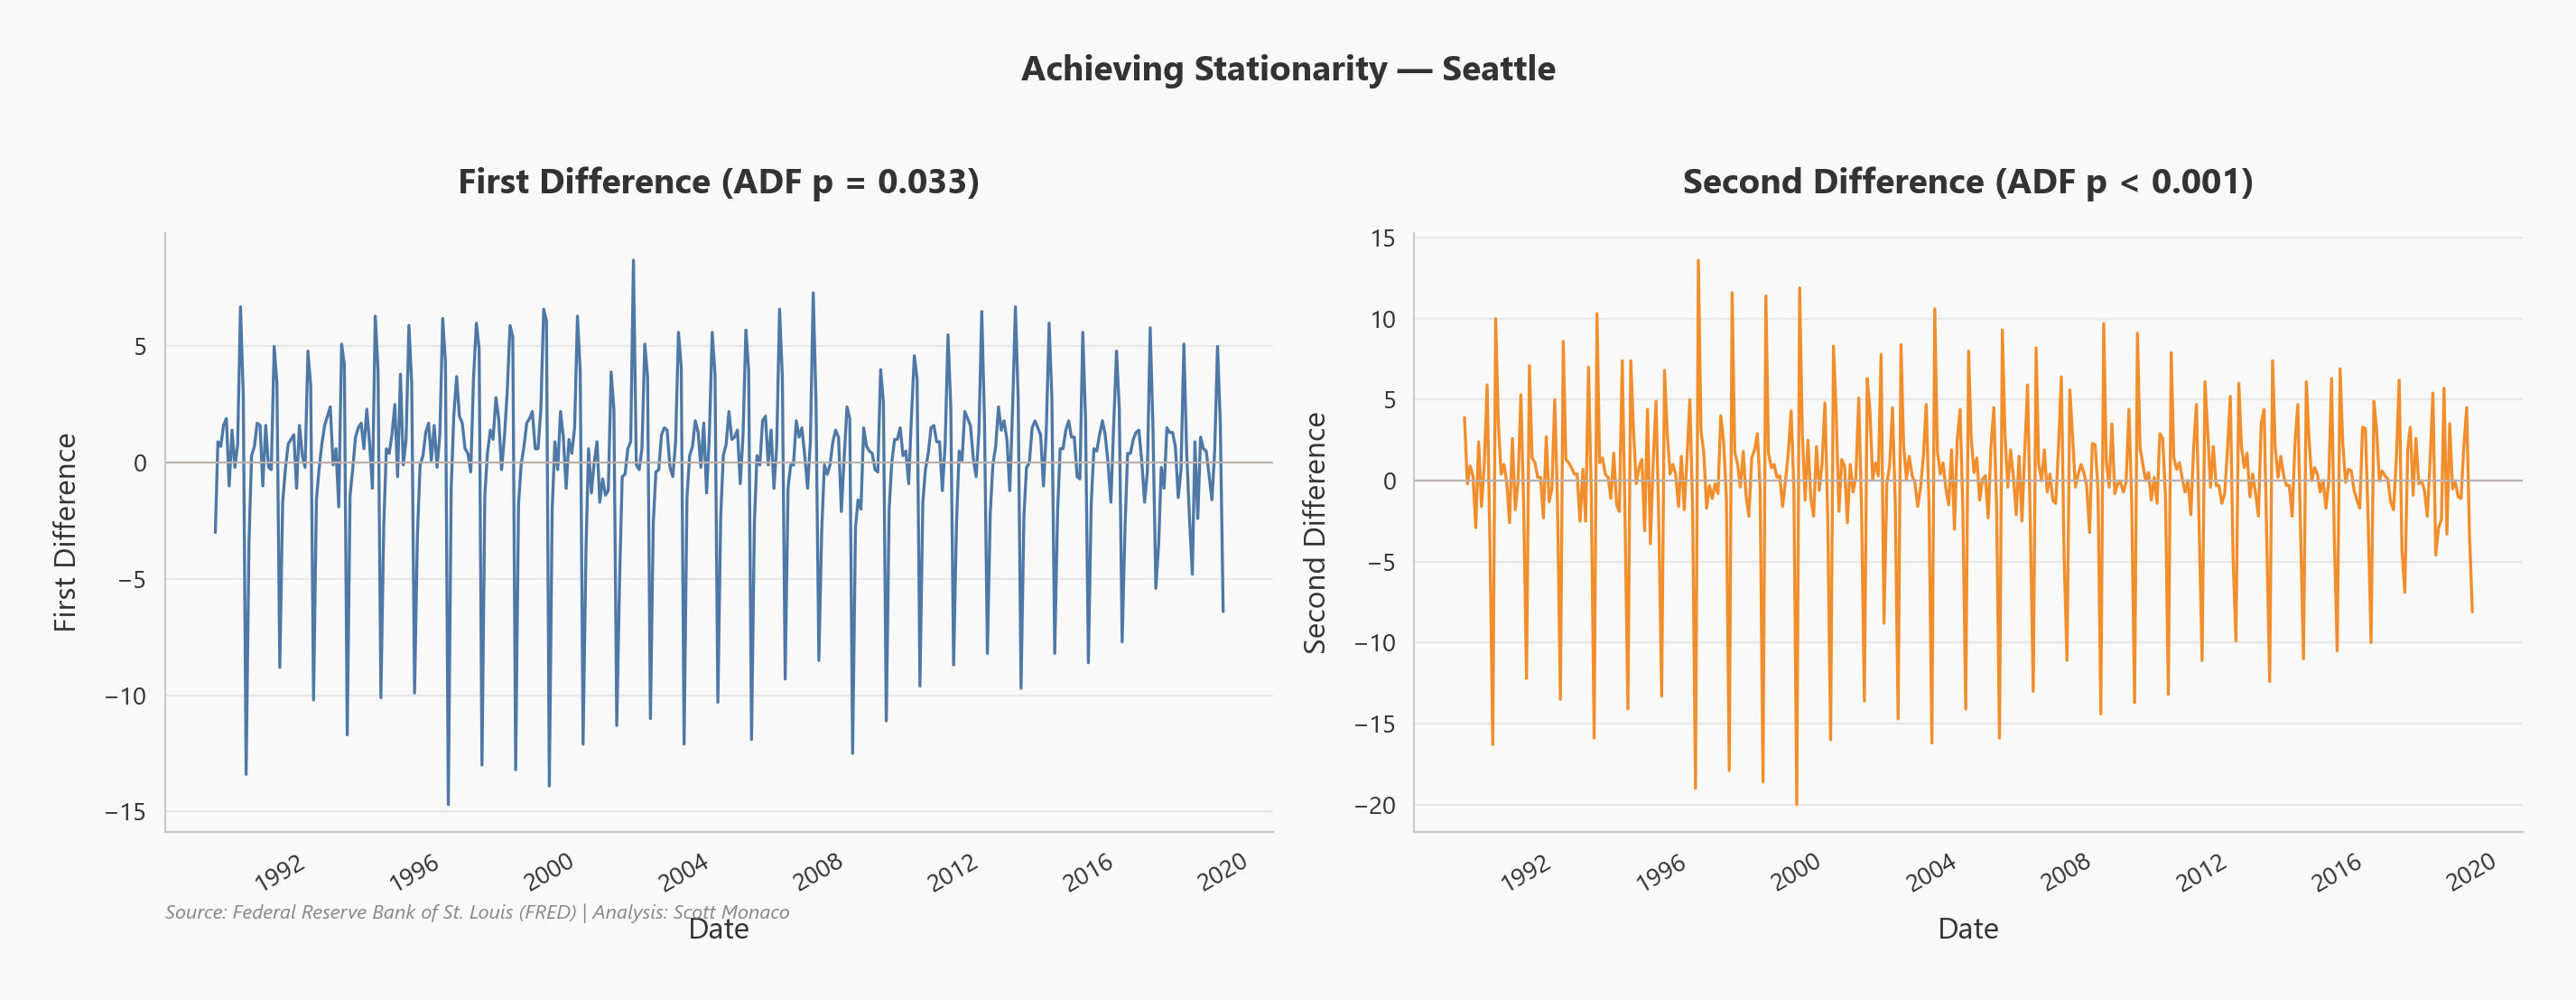
To use a SARIMA model, stationarity is required. The first difference was applied, yielding an ADF test p-value of 0.033. To achieve 99% confidence, a second difference was taken.
ACF and PACF Analysis
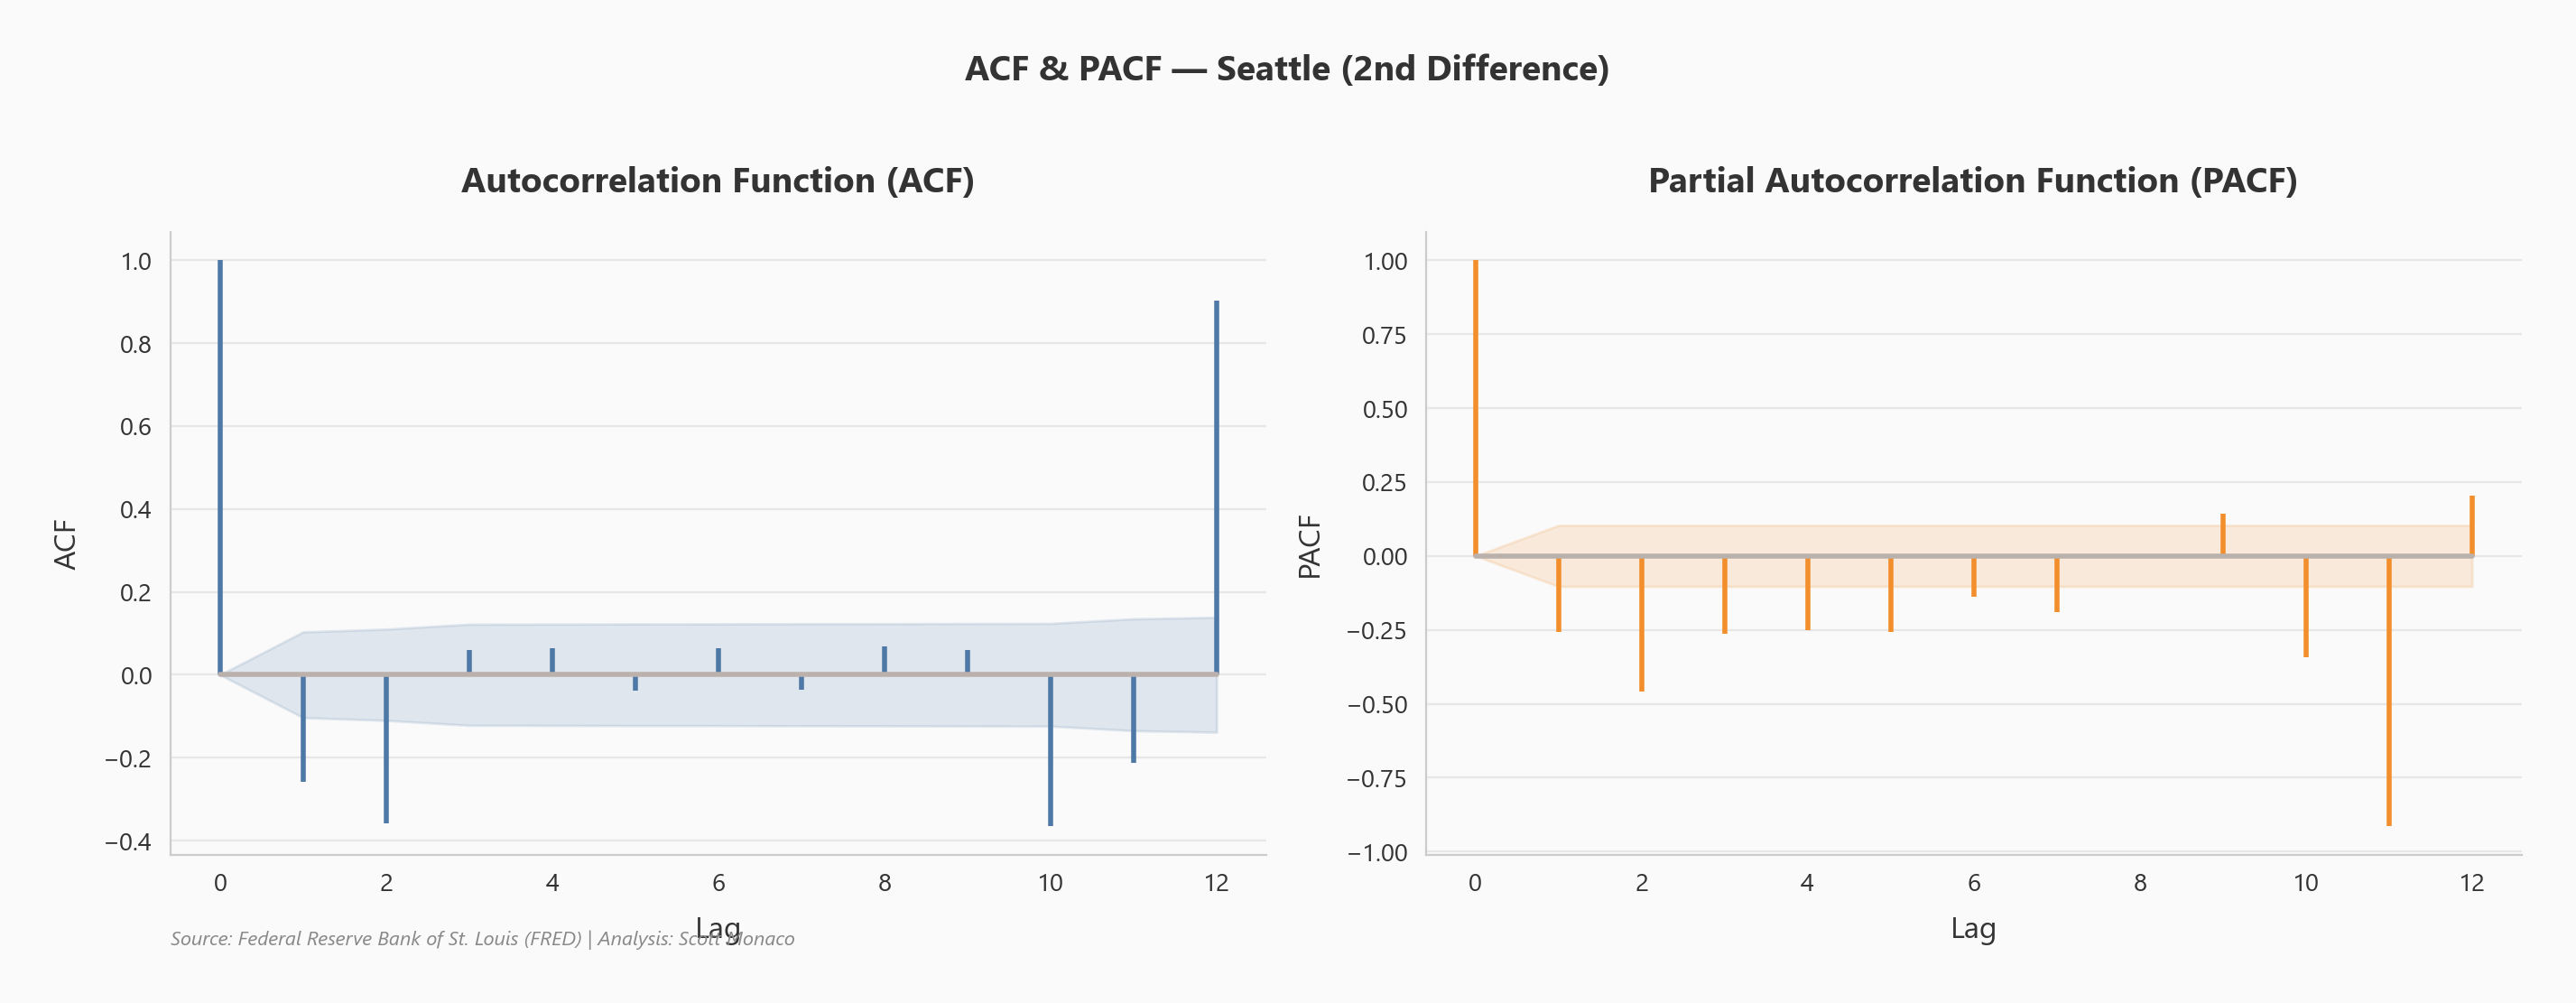
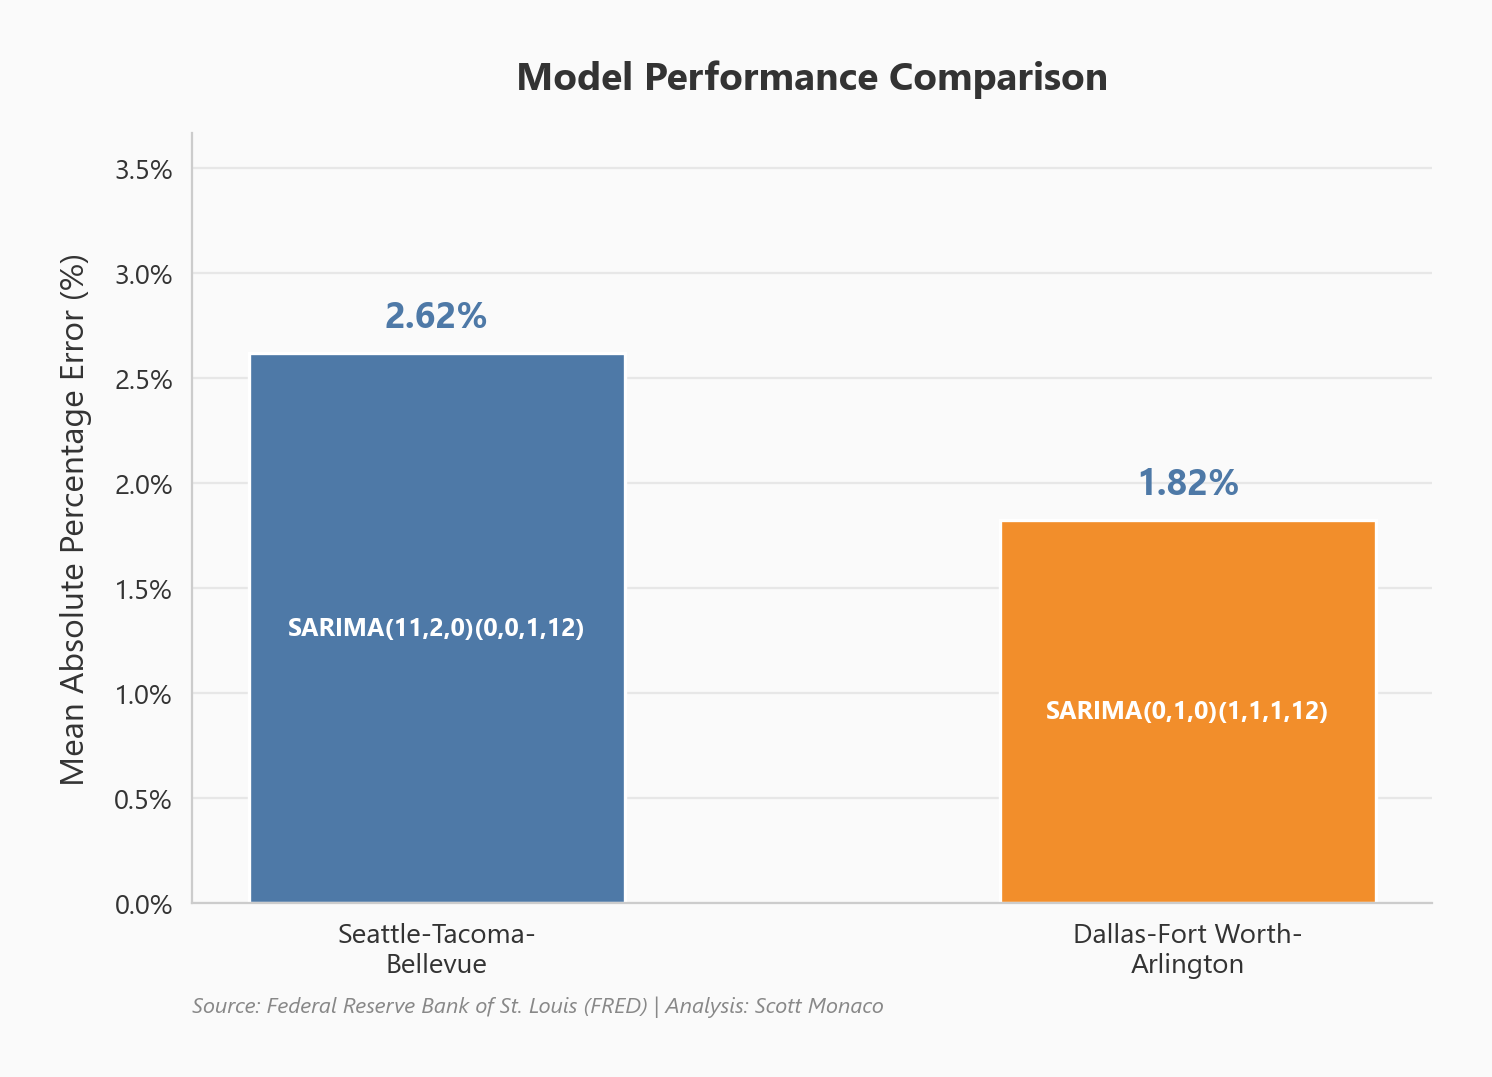
The PACF plot shows the 11th lag is significant (p=11, P=0). The ACF plot shows the 12th lag is significant (Q=1, q=0). This gives a SARIMA order of (11, 2, 0)(0, 0, 1, 12).
Results
SARIMA Predictions
Model Comparison
Next Steps
- Incorporate exogenous variables to enhance predictive power
- Explore Facebook Prophet as an alternative algorithm, well-suited for handling seasonality
- Analyze error plots to identify any systematic patterns the model may be missing