Student Dropout Prediction

Problem Statement
Higher education dropout is a costly problem for institutions and students alike. Using a UCI Machine Learning dataset of 4,424 students with 36 enrollment-time features, this project builds a classifier to identify at-risk students early enough for intervention.
The dataset captures academic path, demographics, and socio-economic factors known at enrollment - meaning the model could flag students before they ever attend a class.
Methodology
Preprocessing & Class Imbalance
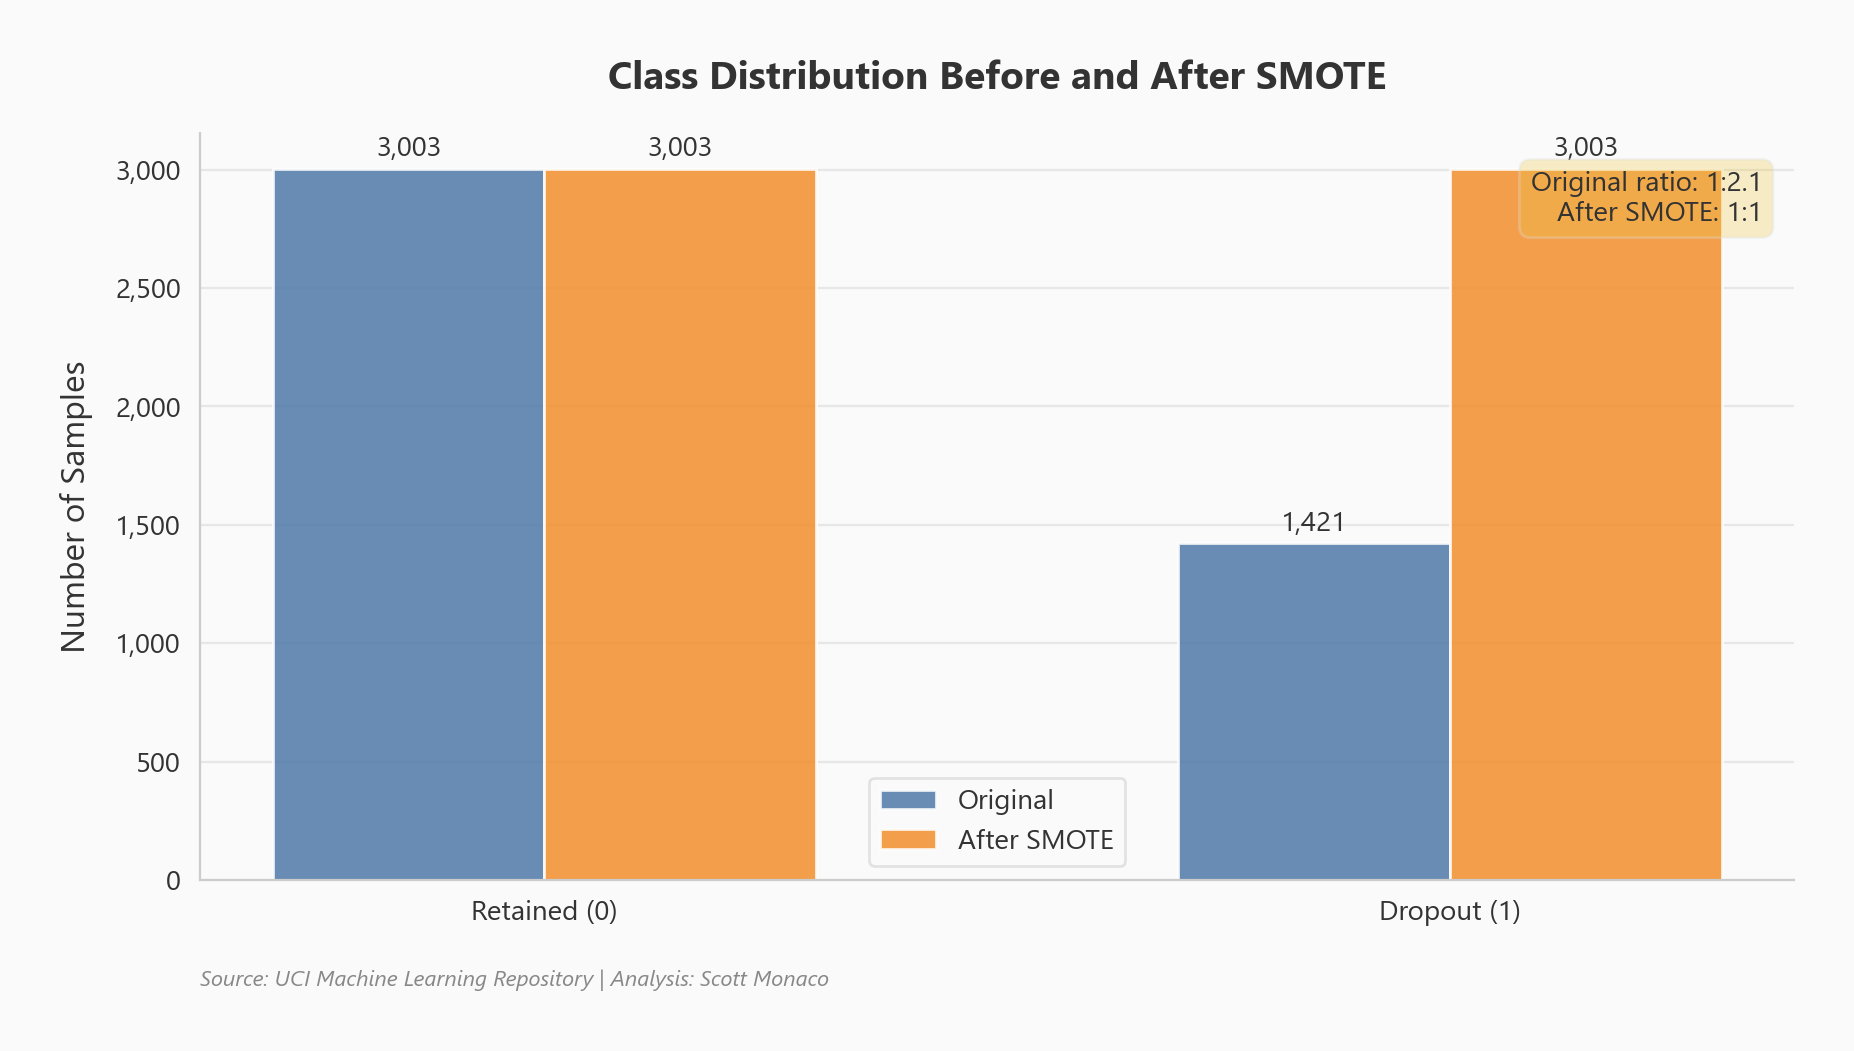
The original three-class target (Dropout, Enrolled, Graduated) was collapsed into a binary problem: Dropout vs. Retained. The resulting class imbalance was addressed with SMOTE oversampling on the training set.
Feature Engineering
Continuous variables were scaled using Min-Max normalization, fit on the training set and applied consistently to the test set to prevent data leakage.
Results
Model Performance
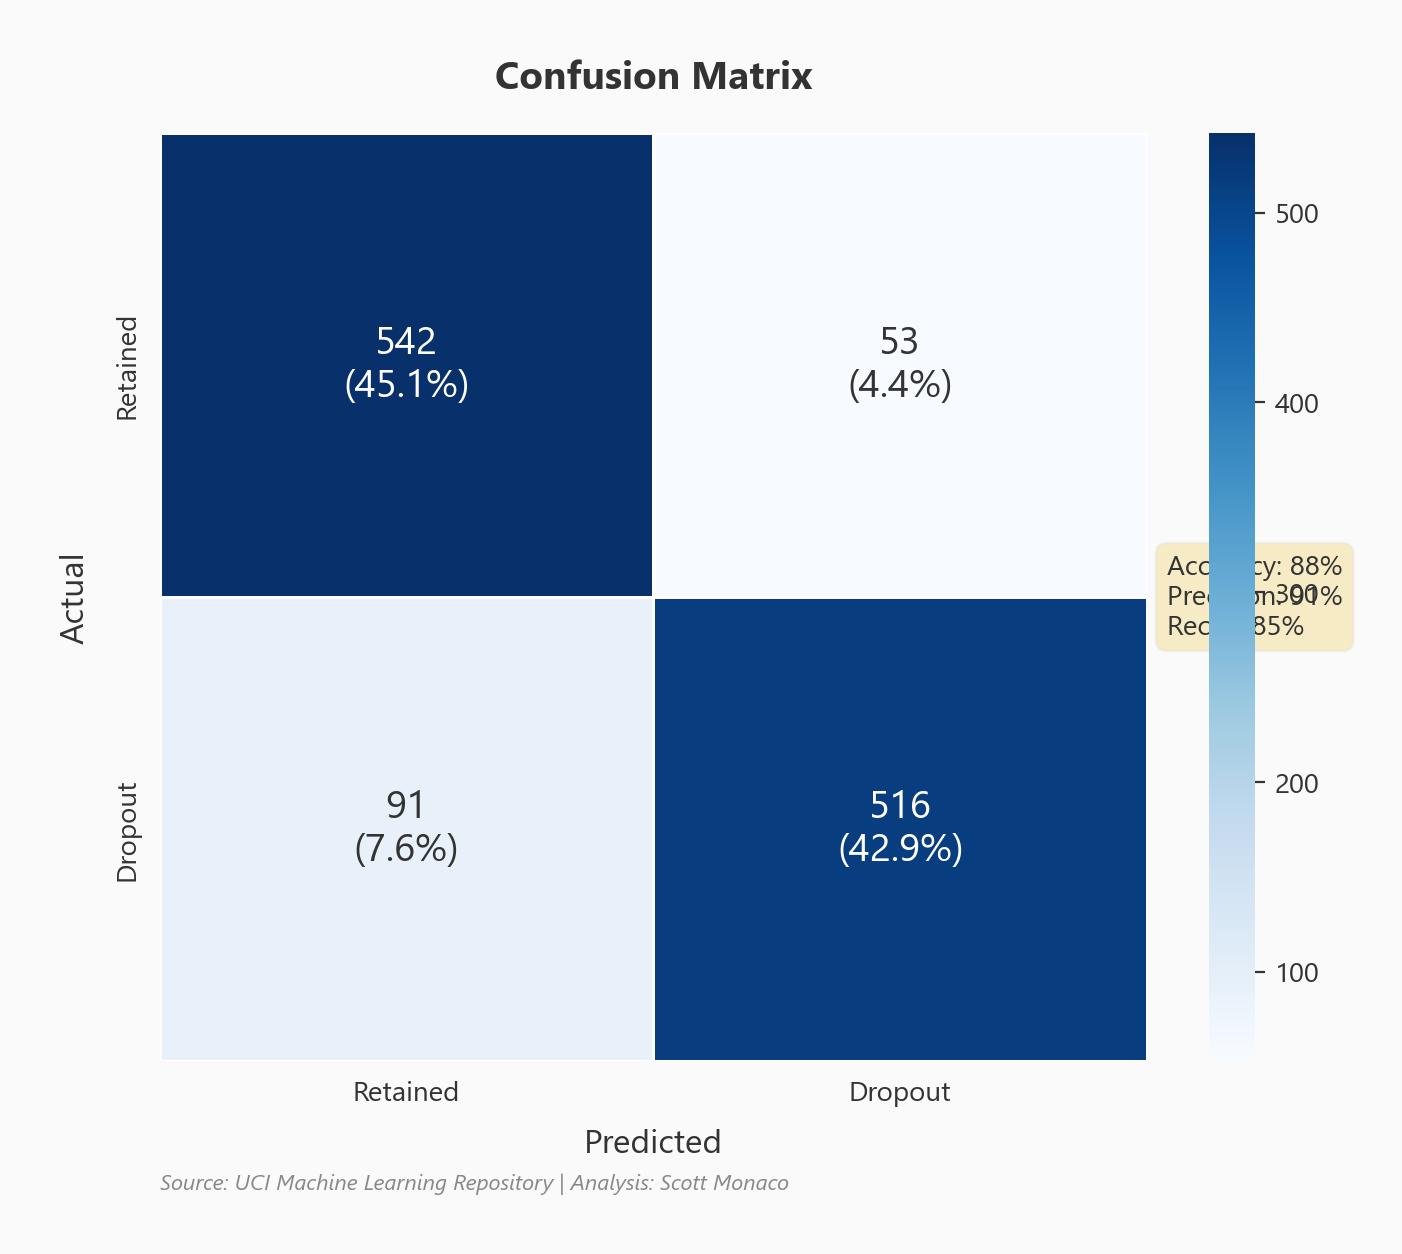
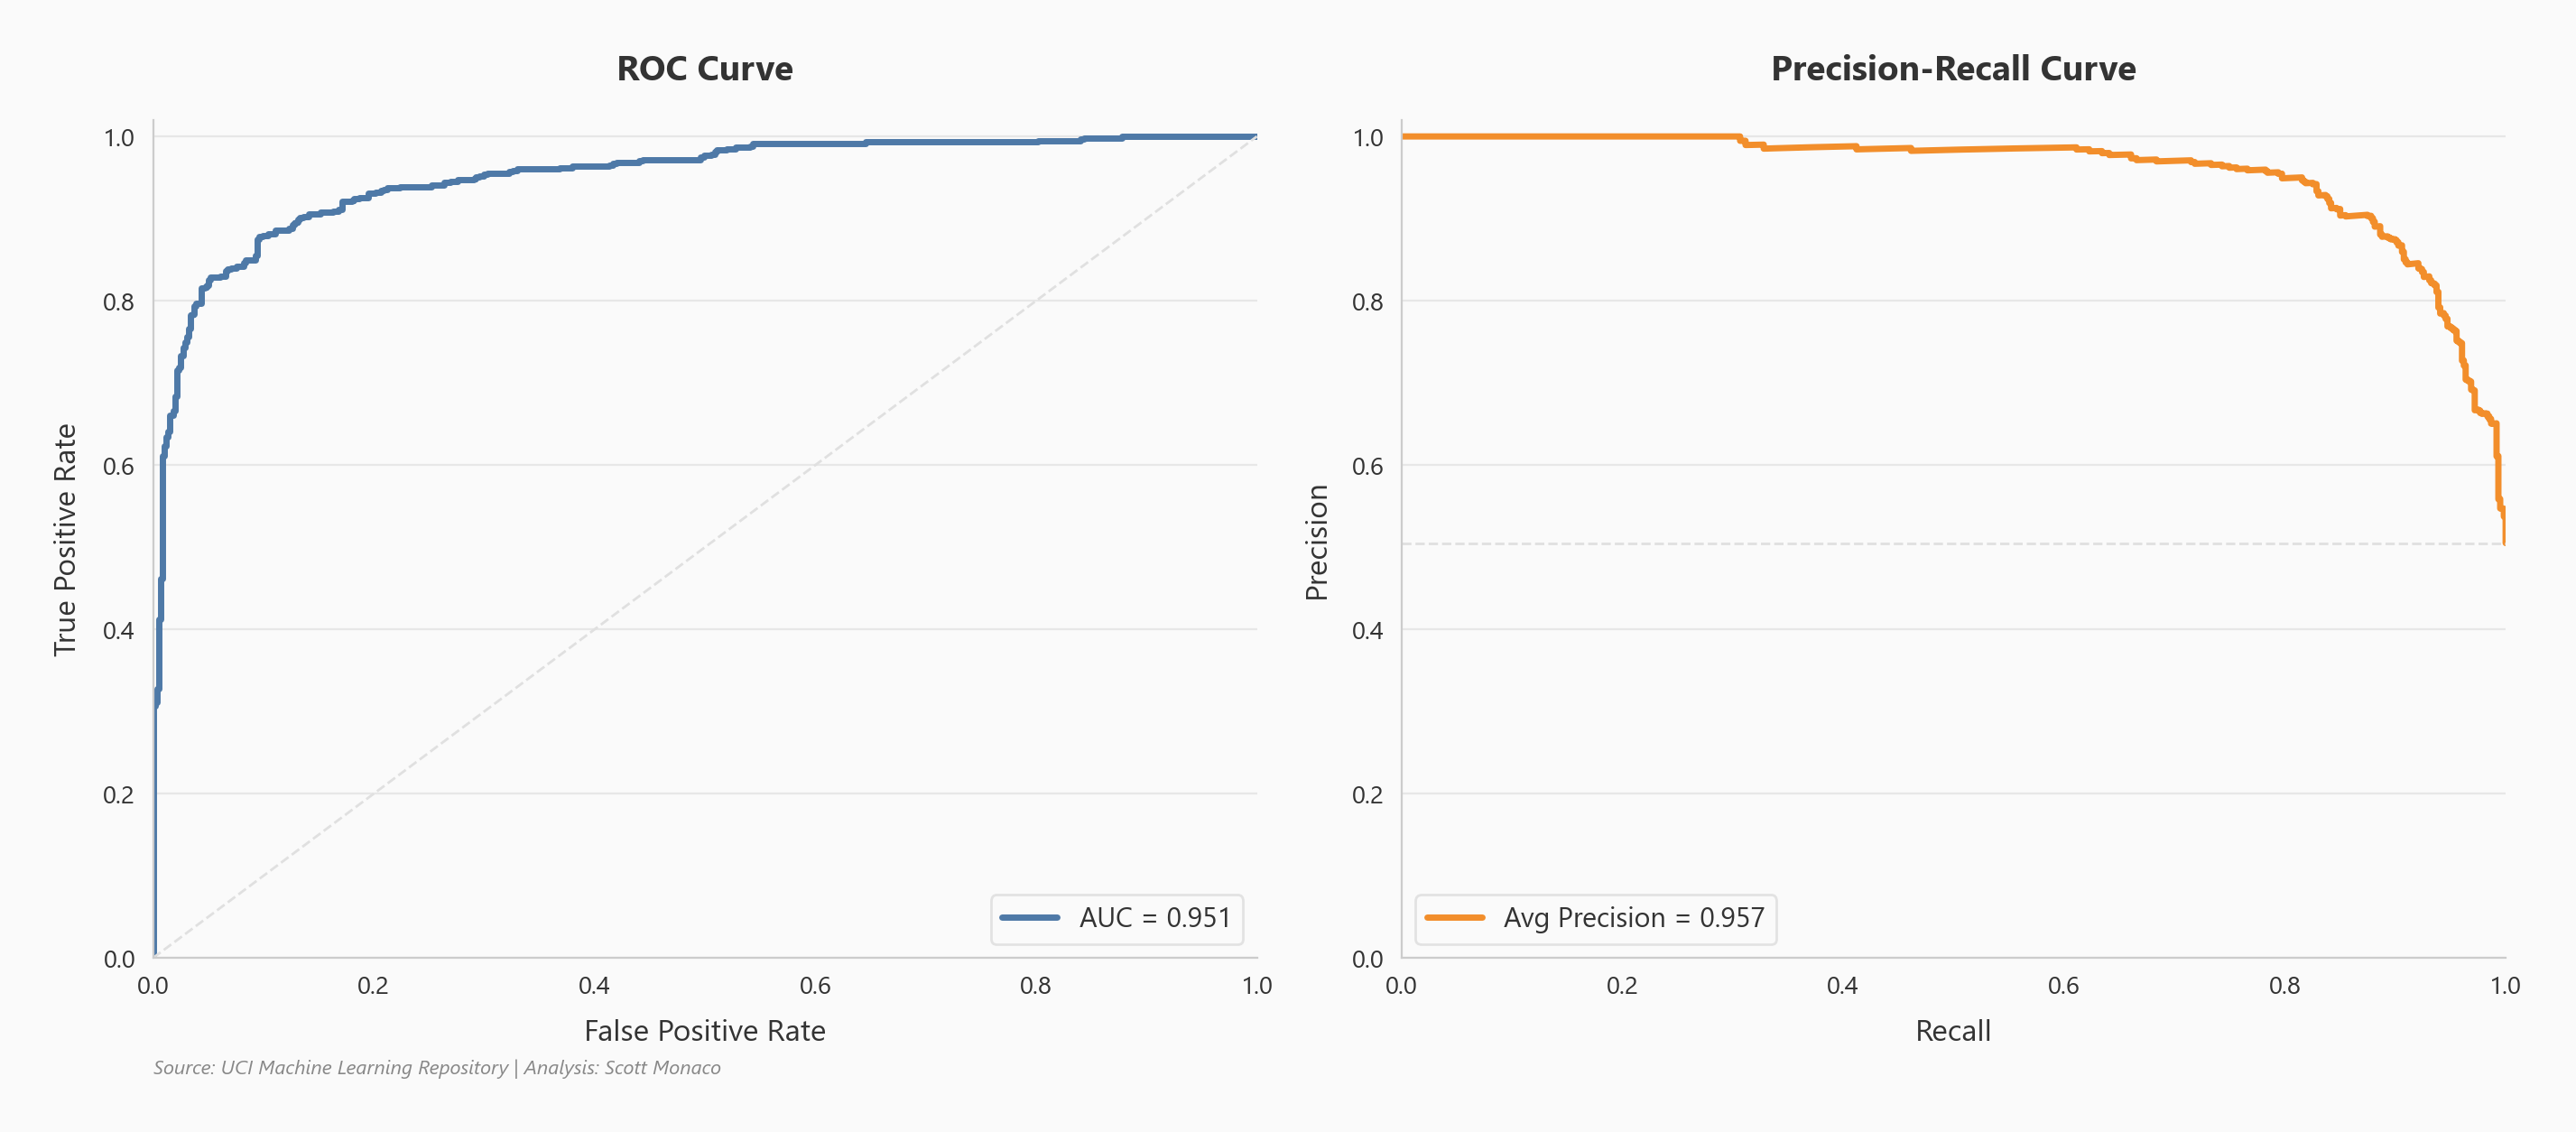
A CatBoost Classifier achieved strong performance on the held-out test set:
| Accuracy | Precision | Recall |
|---|---|---|
| 89% | 87% | 91% |
Feature Importance
Financial & Demographic Risk Factors
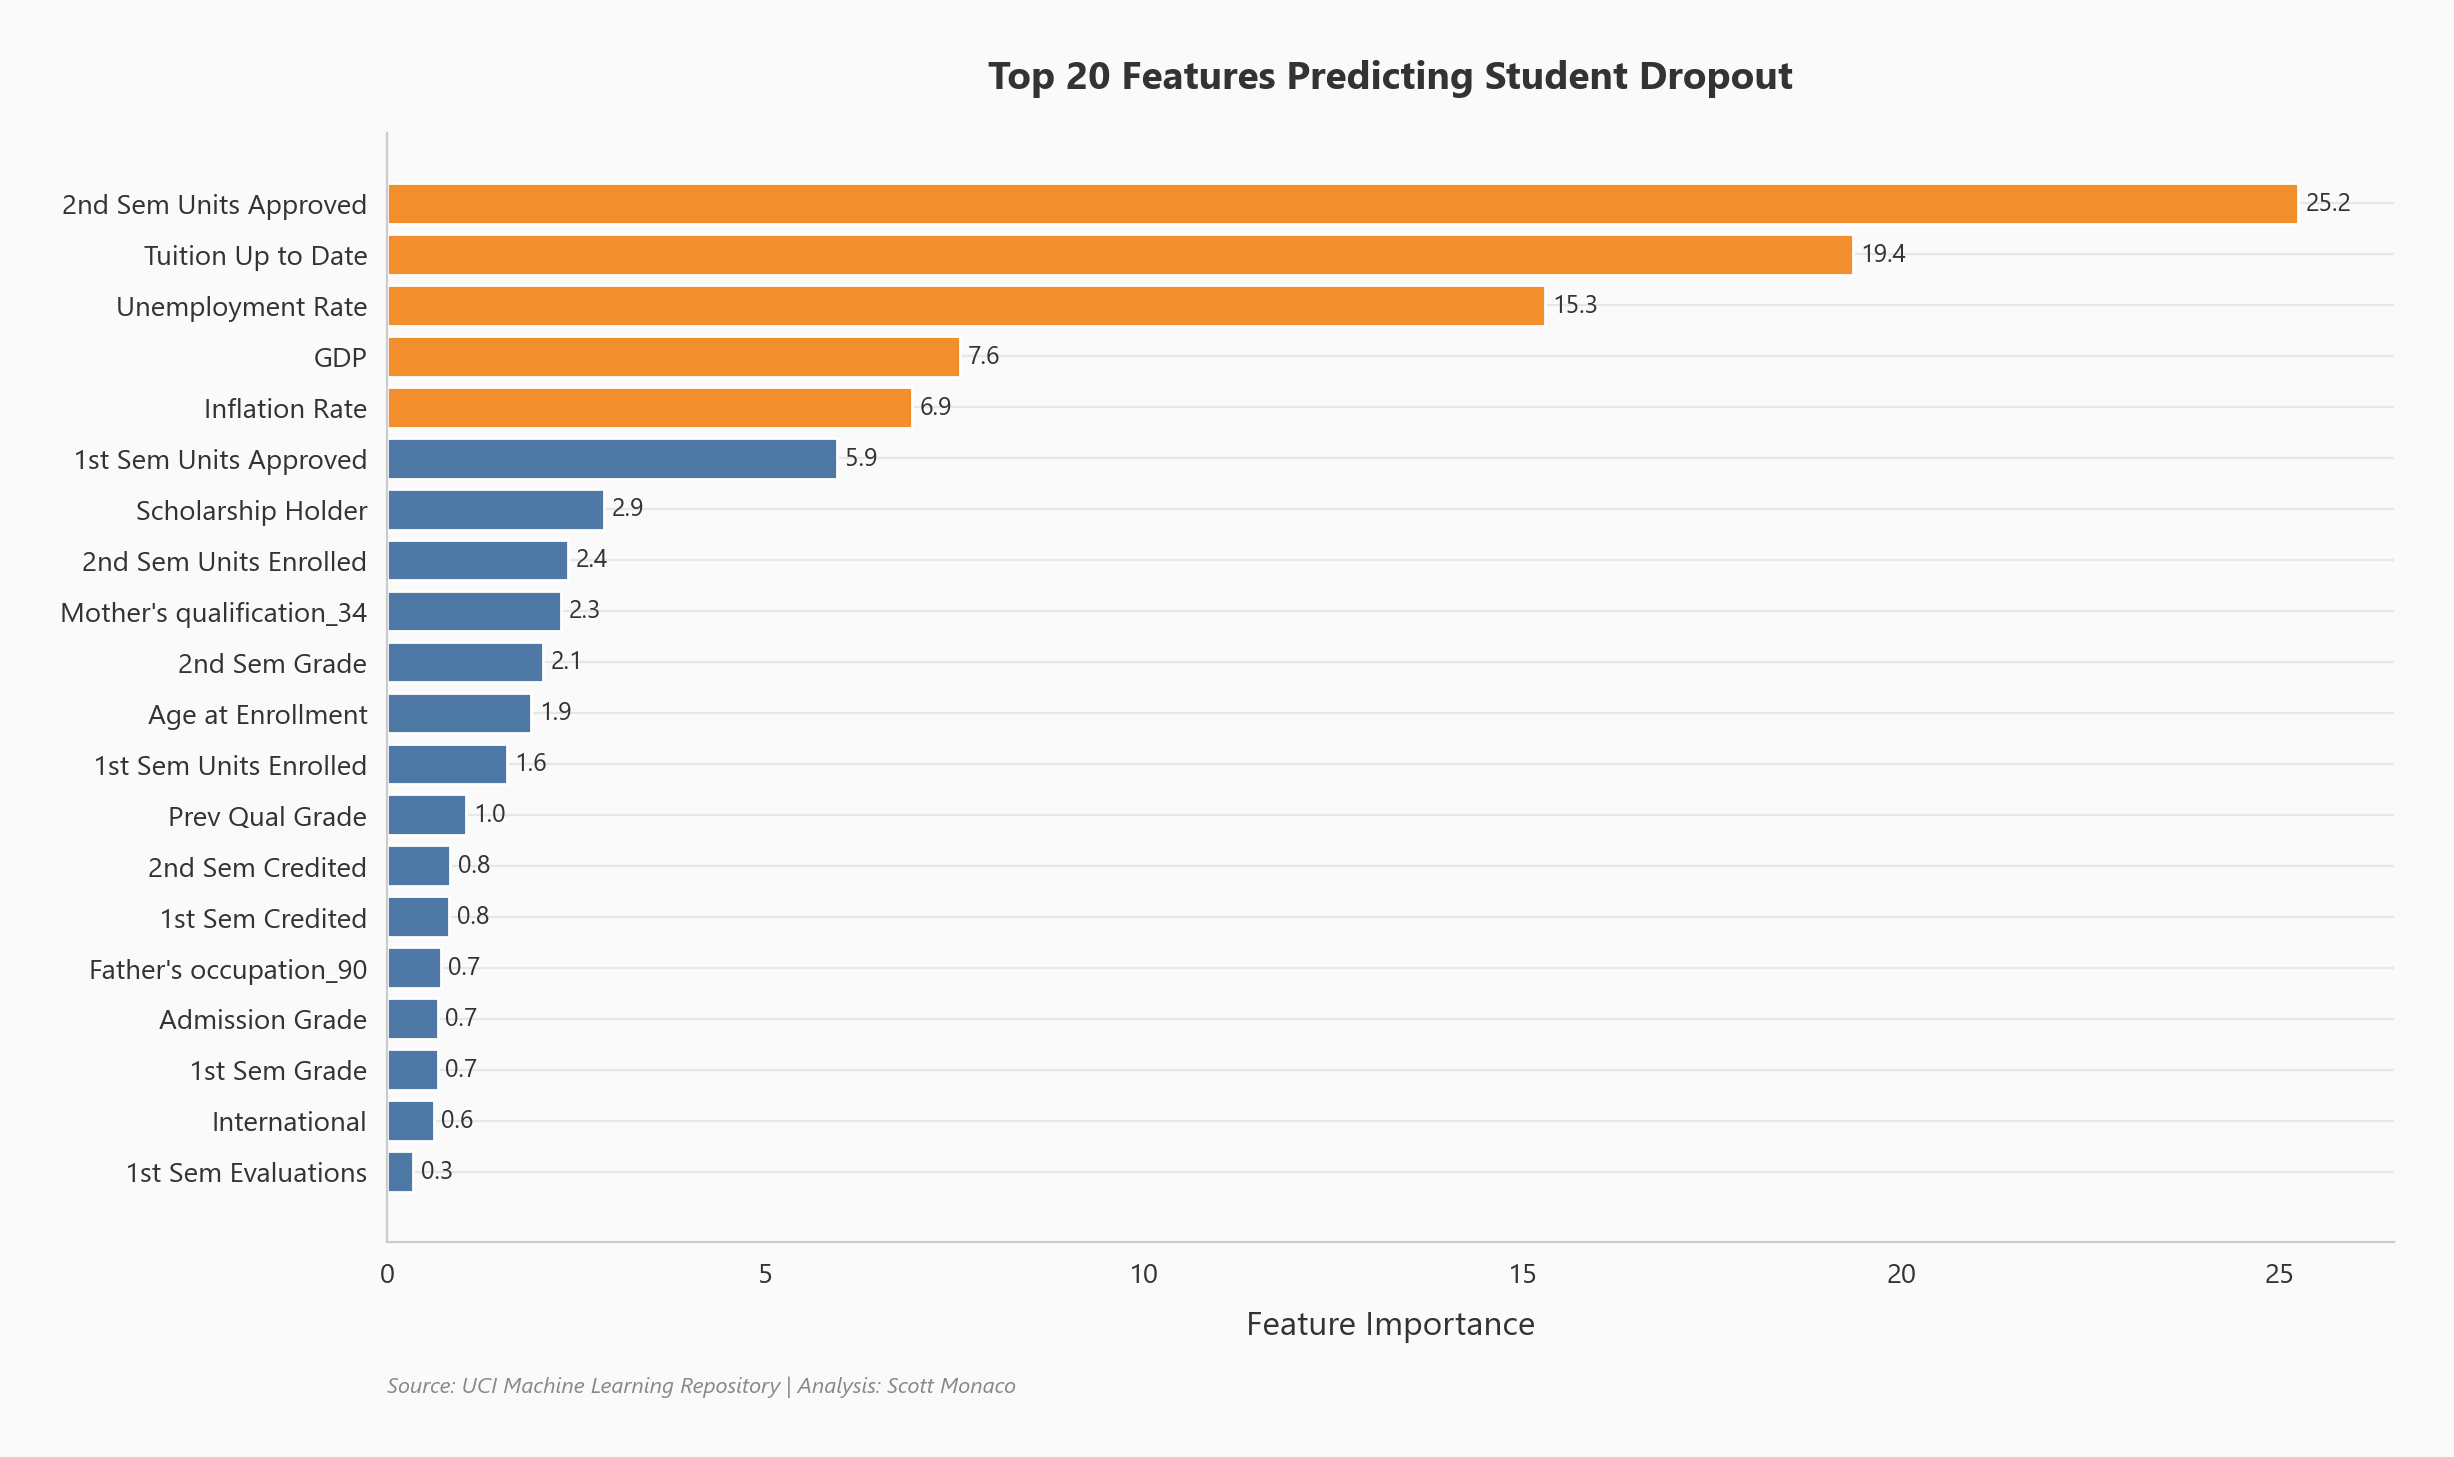
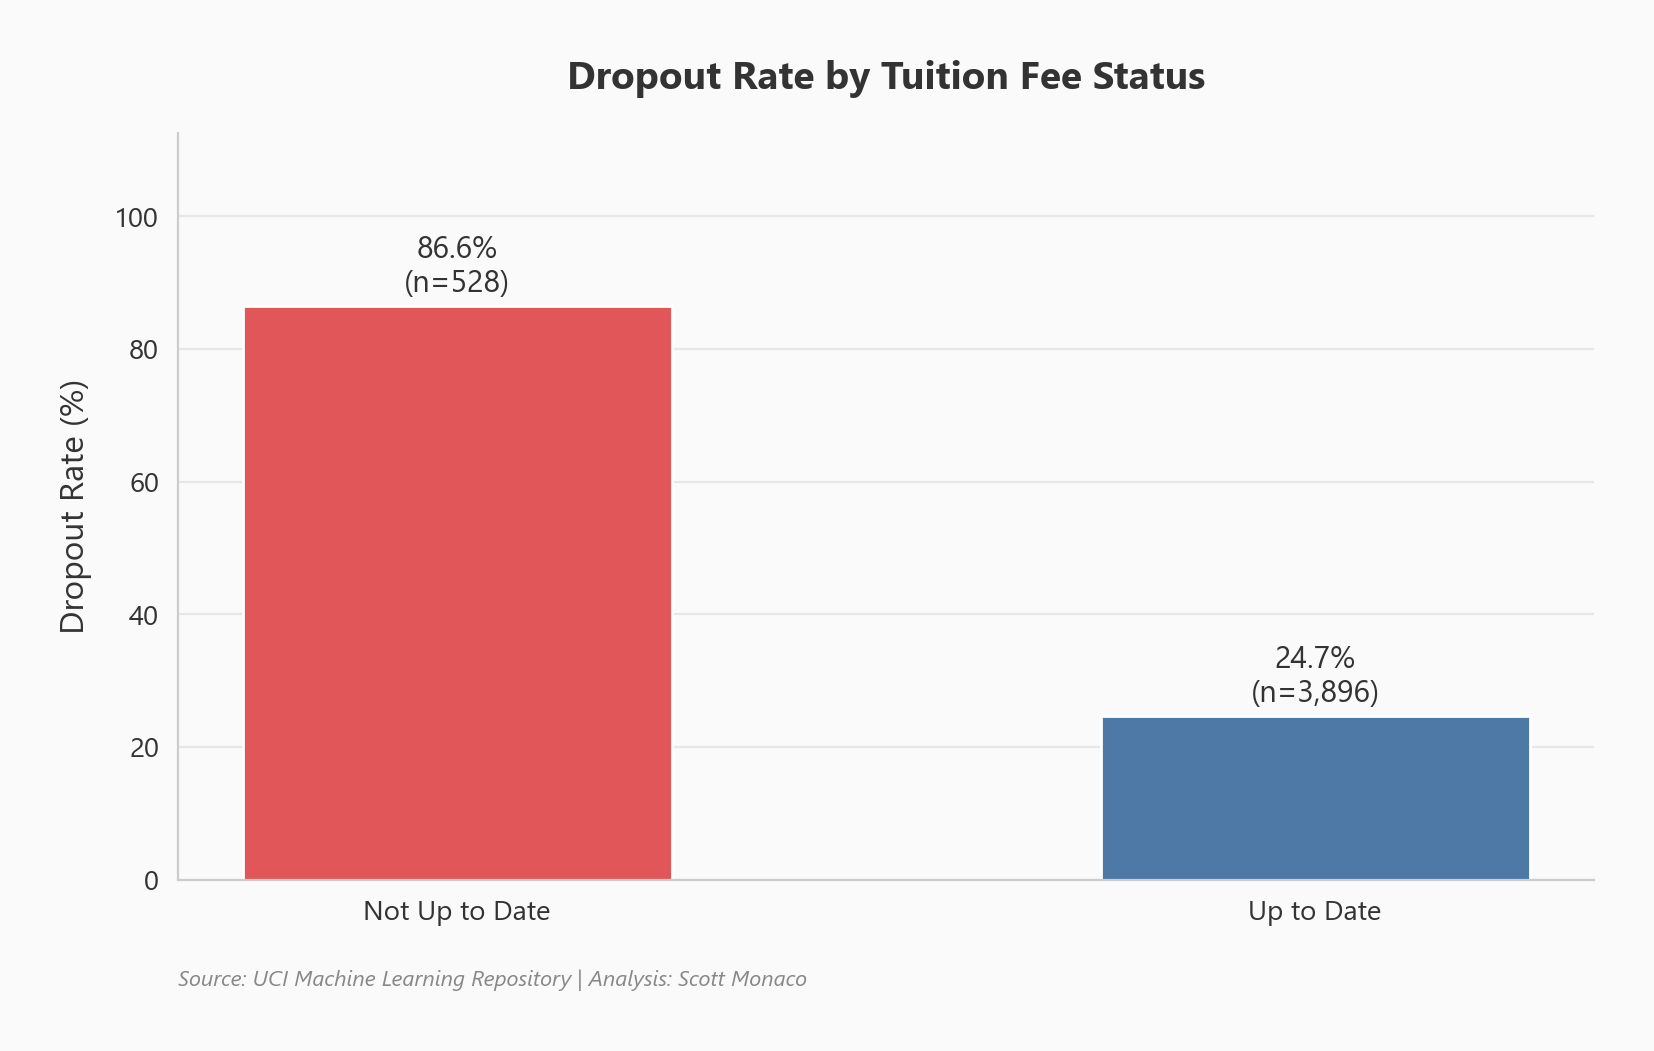
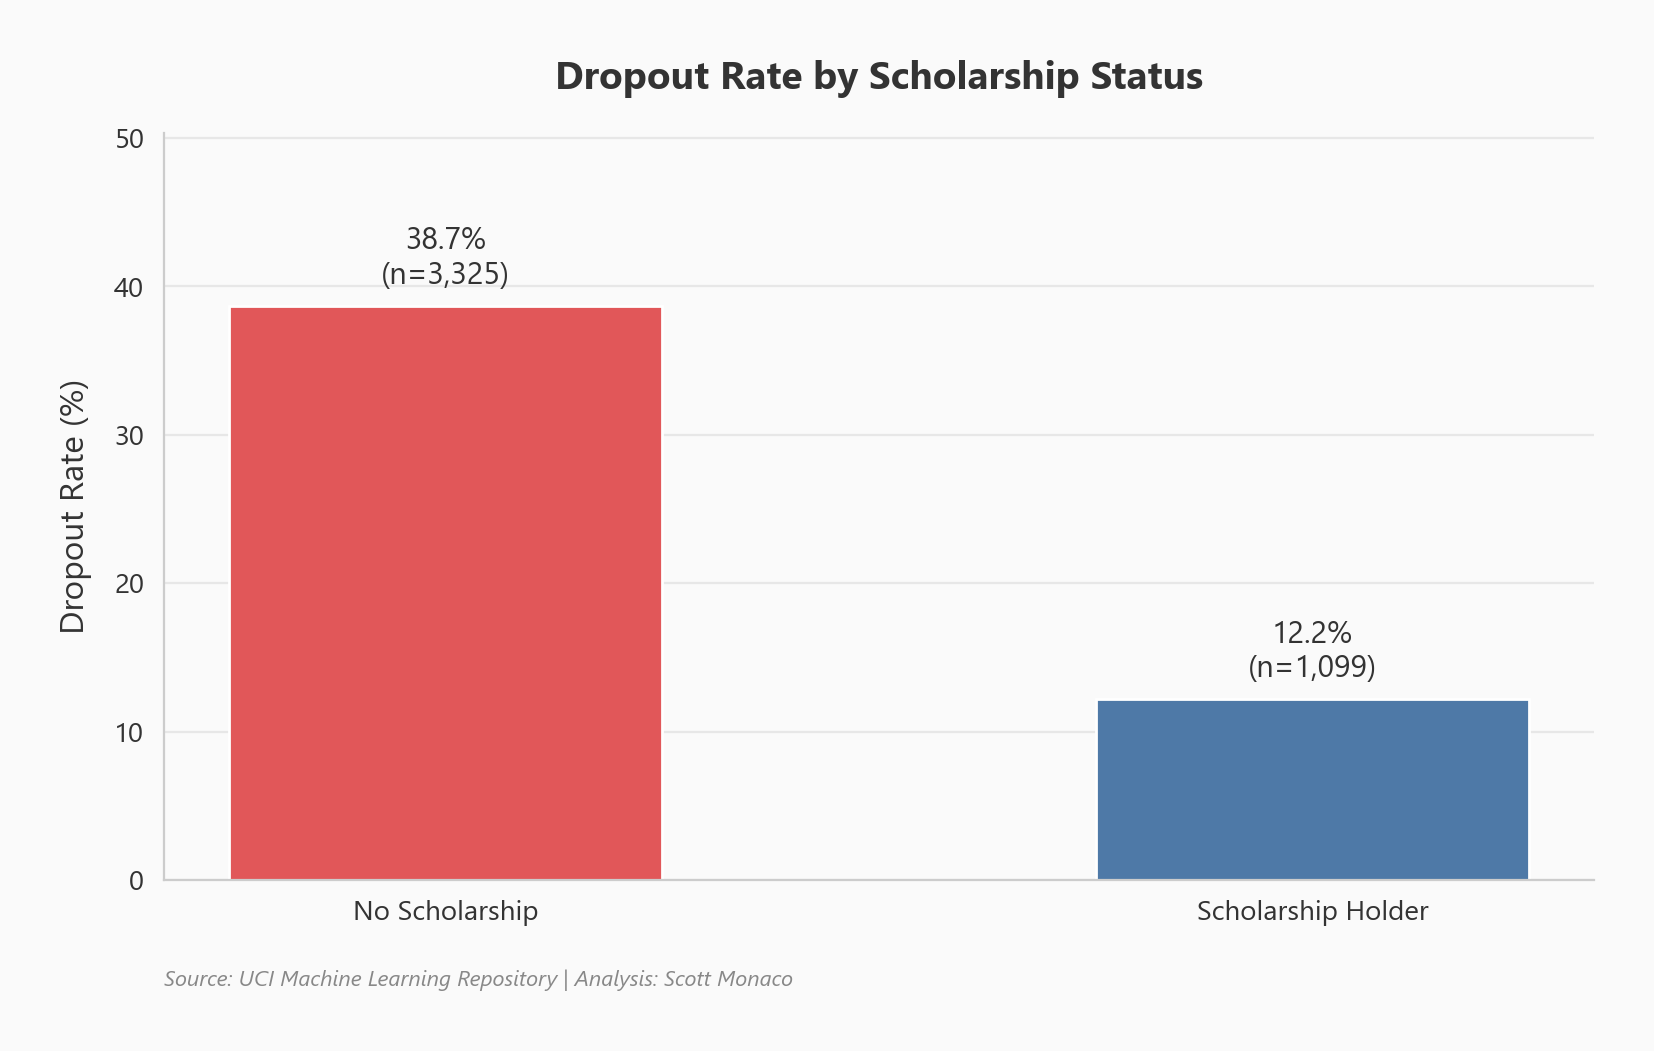
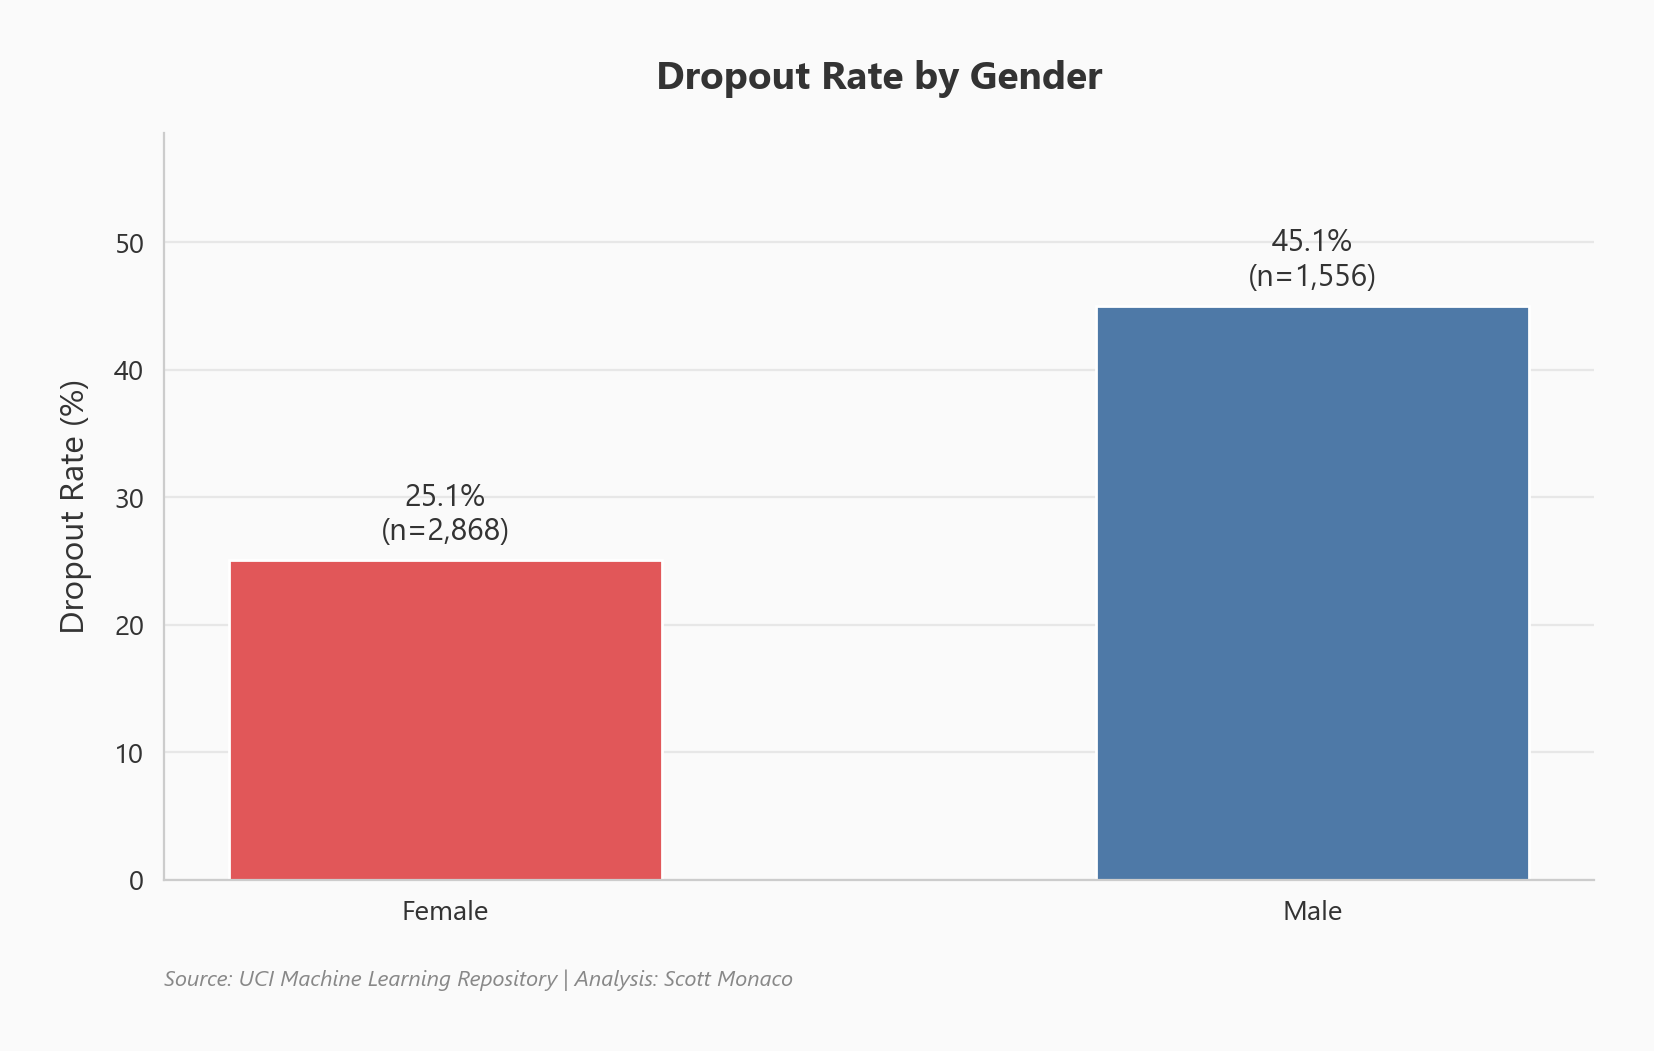
Students with tuition debt, without scholarships, and from lower-income backgrounds showed meaningfully higher dropout rates - suggesting targeted financial aid could be a powerful retention tool.
Next Steps
- Deploy the model as a scoring API for real-time enrollment risk assessment
- Apply SHAP values for per-student explainability to guide targeted interventions
- Explore ensemble methods (stacking, blending) for incremental accuracy gains