SAM: Strategy Note3 min read

Paid in Time: Unemployment Is Not Rising Much, It Is Lasting Longer
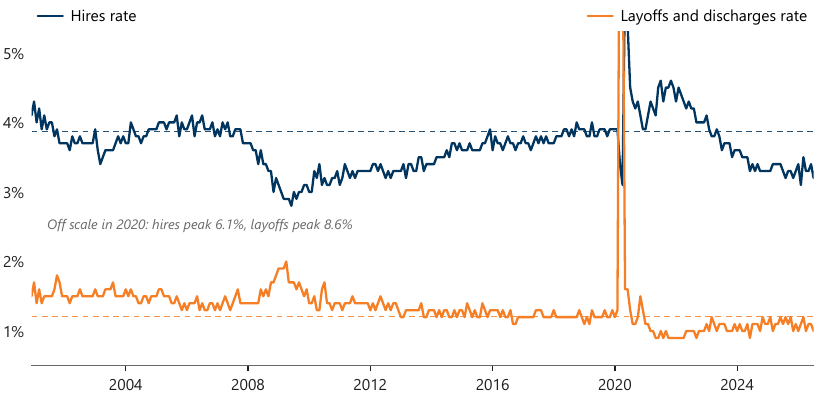
Exhibit 1: US hires and layoffs rates as a per cent of employment since 2000, showing hiring falling below its 2019 average while the layoff rate also sits below its 2019 average

The American labor market has been sending two signals that look contradictory. The unemployment rate is 4.1 per cent, barely above the 3.7 of 2019, and layoffs are at 1.1 per cent of employment, lower than they were before the pandemic. At the same time, hiring has fallen to 3.3 per cent of employment from 3.9, and almost everyone who follows the market describes it as frozen.

This note argues that both readings are right, and that they describe different people.

The way into it is to treat unemployment as something with entrances and exits rather than as a single number. The entrances have barely moved: about the same share of people fall into unemployment each month as in 2019. The exits have. Of everyone unemployed in a given month, 24.3 per cent are working the next month, against 27.6 per cent in 2019.
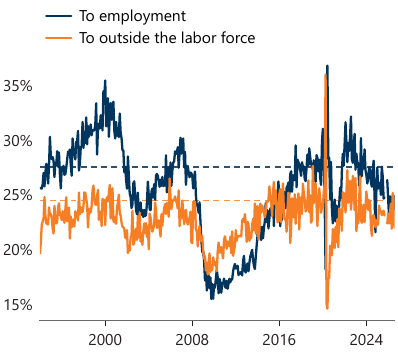
Leaving unemployment: destination of last month's unemployed, per cent, seasonally adjusted. The share moving into work has fallen while the share leaving the labor force has not. Source: BLS Current Population Survey gross flows via FRED.
That combination does something specific. It does not push many more people into unemployment, so the headline rate rises only a little. It does keep the people who are already there for longer, so spells stretch out: the median has gone from 9.2 weeks to 11.0, and the share of the unemployed who have been looking for at least six months is 26.6 per cent against 21.2.

Splitting the rate by spell length makes the point exactly. Long spells account for about 70 per cent of the entire rise in unemployment since 2019.
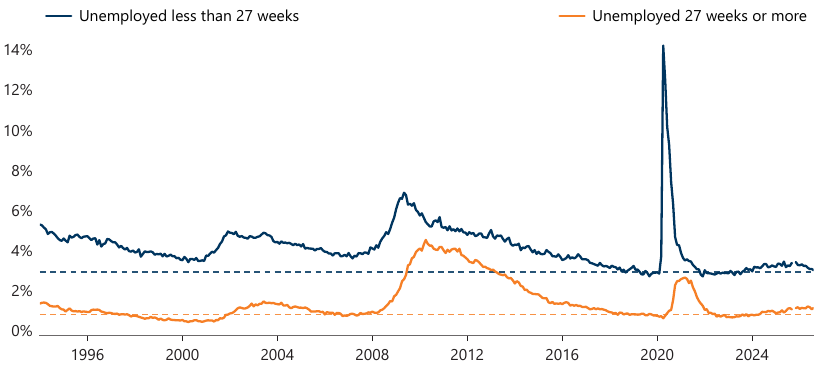
Most of the rise in unemployment is long spells: unemployment by duration, per cent of the labor force, seasonally adjusted. Source: BLS Current Population Survey via FRED.
One obvious alternative reading is that people simply gave up and left the labor force, which would make the duration figures a change in who gets counted. The note tests that and finds the opposite: exits from unemployment to outside the labor force are slightly lower than in 2019, not higher.

None of this explains why hiring slowed, and the note is explicit that it cannot. It also shows how much of the comparison depends on choosing 2019 as the benchmark, which turns out to matter. Read the note for that, and for the charts.

Corrected 25 September 2026: the note gains a tenth exhibit charting the unemployment rate against long-spell share and duration since 1994. Drawing it showed that the note’s historical comparison had counted recent months, today’s included; restricted to the pre-pandemic record, the finding is stronger, not weaker. A mislabelled peak on the fourth exhibit’s chart is also fixed. Details are on the note’s methodology page.

Document

Method: Descriptive analysisID: sam_005Download the PDF

  • labor markets
  • unemployment
  • united states
  • descriptive