Is It AI or Is It the Fed? Generative AI Exposure, Monetary Tightening and the Post-2022 White-Collar Slowdown
Since the end of 2022, the industries that employ most of the country’s programmers, analysts, accountants and lawyers have stopped adding jobs, and their hiring of recent graduates has weakened. The popular explanation is generative AI, since ChatGPT arrived just as the data turned. But two other things happened in the same window. The Federal Reserve began raising rates in March 2022, eight months before ChatGPT, and the two-year Treasury yield rose 3.6 percentage points by late 2023. And the same industries had over-hired in 2021 and early 2022.
Three exposures, one horse race
The three shocks coincide in time, so they cannot be separated in aggregate data. They can be separated across industries. The paper builds three characteristics for 205 detailed industries covering 120 million jobs: AI exposure, the Felten, Raj and Seamans index of how closely an industry’s occupations match what language models do; rate sensitivity, each industry’s historical employment response to identified monetary policy surprises over 1990 to 2019; and pandemic displacement, how far above or below trend the industry stood in February 2022.
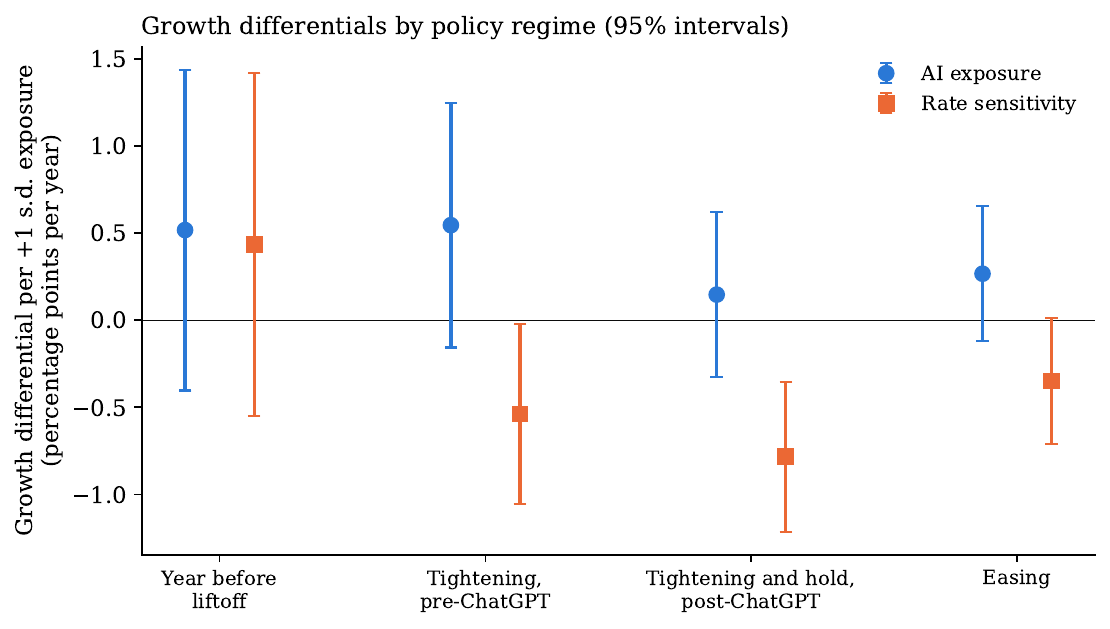
These exposures are nearly unrelated: the correlation between AI exposure and rate sensitivity is minus 0.06, which is what makes a horse race possible. The paper regresses each industry’s detrended employment after February 2022 on all three exposures at once, month by month and pooled into three regimes: tightening before ChatGPT, tightening and hold after it, and easing from September 2024.
What headcount says
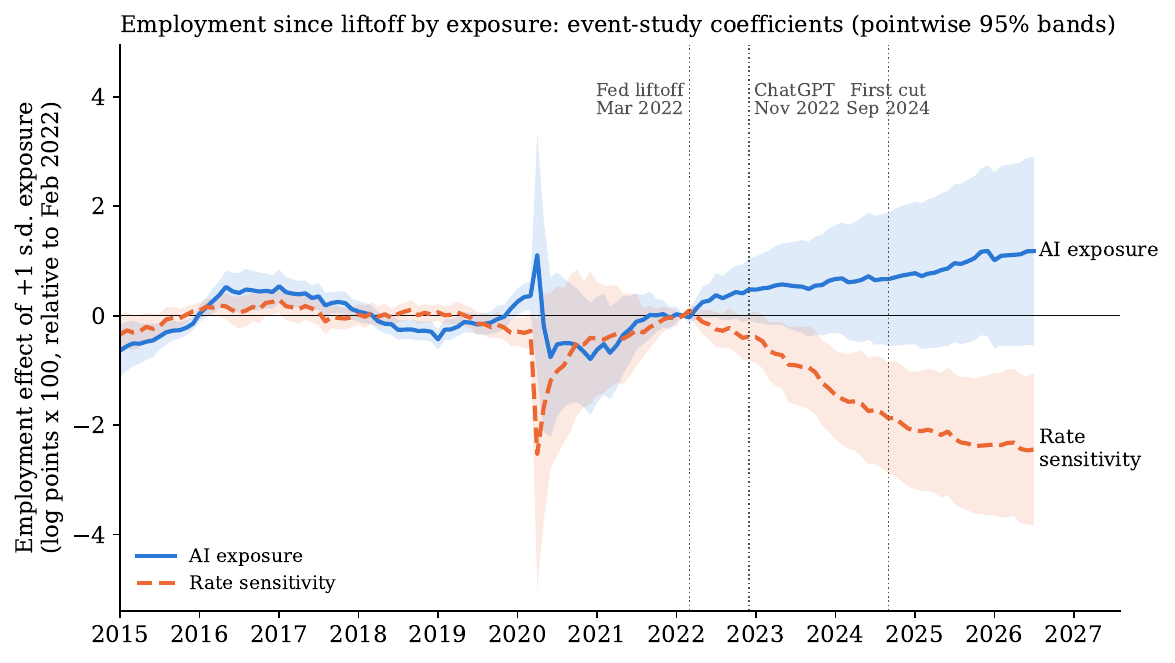
AI exposure predicts nothing about headcount. Its coefficient is positive in every regime, 1.1 log points per standard deviation by the easing period with a standard error of 0.8, and it does not break at ChatGPT. Replaying the design at nineteen fake base years gives AI coefficients with a standard deviation of 2.1 log points, so 1.1 is what the design produces when nothing has happened. That cuts both ways: an AI effect of two or three percent over four years would not stand out either.
Rate sensitivity does predict losses. Nothing happens in the first nine months of tightening; then a one standard deviation more rate-sensitive industry falls 0.9 log points behind during the hold and 2.0 during easing. In growth terms the disadvantage widens from 0.5 to 0.8 percentage points a year through the hold and narrows to 0.3 once the Fed begins cutting, a narrowing rather than a reversal.
The young workers
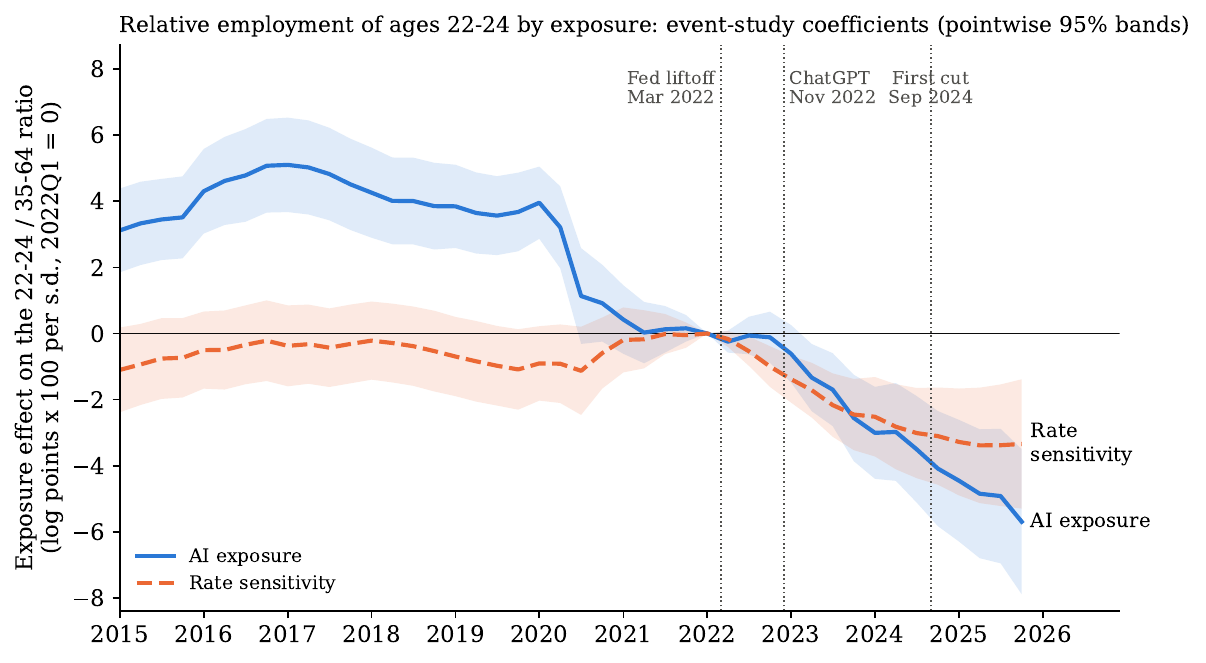
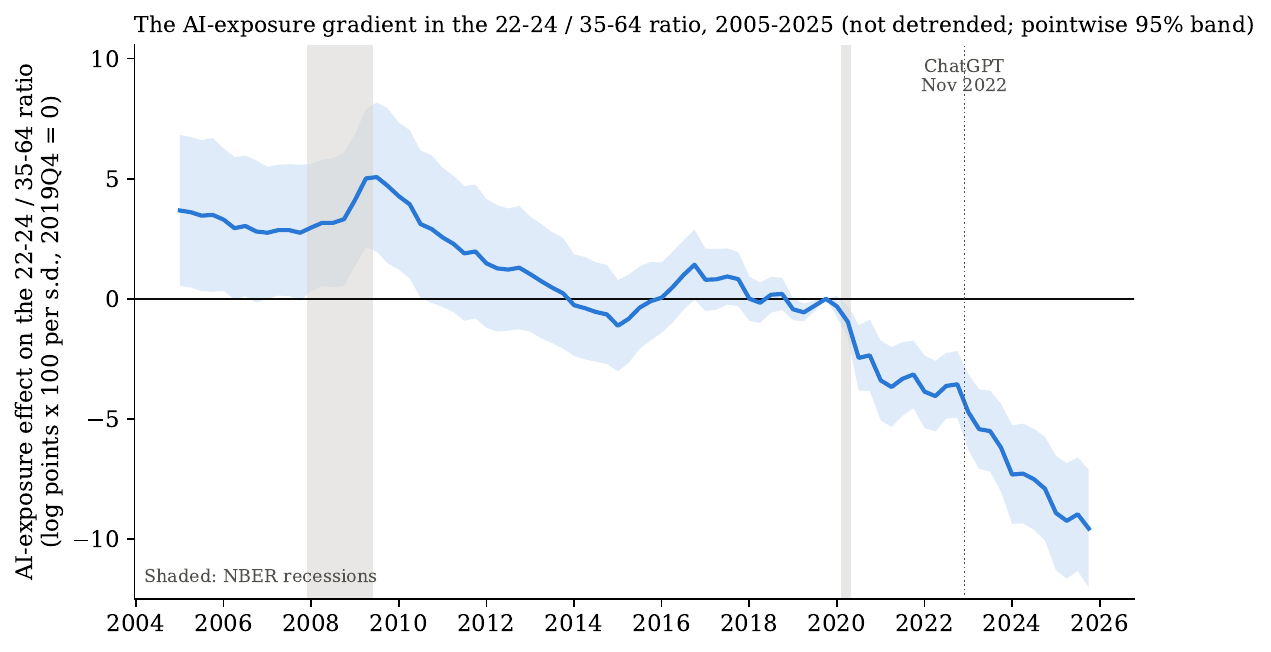
The strongest evidence for an AI effect in the literature concerns who is hired: payroll microdata show the youngest workers in exposed occupations losing ground since 2022. The paper finds the same pattern in public Census data by age and industry. Within industries, employment of 22 to 24 year olds relative to 35 to 64 year olds is 4.9 log points lower per standard deviation of AI exposure by 2025, and 3.2 lower per standard deviation of rate sensitivity. Workers aged 25 to 34 show nothing on either.
What it means
In headcount, the post-2022 slowdown in white-collar industries looks like a hangover and a cycle, not a technology shock. Among the youngest workers there is a real and large shift, and an account of it that begins in November 2022 begins too late. The design is cross-sectional and rests on the assumption that no other post-2022 shock loaded on industries in proportion to these exposures. The next step is the same exposures at the level of firms and workers, where adoption can be measured rather than proxied.