Owning a home is seen as a financial holy grail, Michael Luca and Raymond Fisman wrote in the
Wall Street Journal
in September, but money in a house is money not in an index fund. Their evidence: from 2015 to 2025,
home prices rose about 87 per cent and the S&P 500 about 235 per cent.
Those numbers reproduce. Adding back what each asset pays its owner, the rent a homeowner no longer
owes and the dividends a shareholder collects, still leaves stocks about five points a year ahead.
But a household does not choose between two assets. It chooses between buying with a mortgage and
renting while investing the difference. This note runs that comparison for every month of purchase
since 1975.
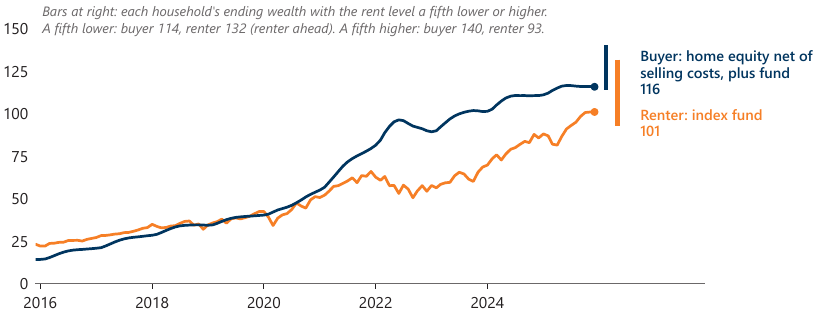
Over the essay's decade, a leveraged buyer finished close to the renter: wealth of each household per 100 of purchase price, bought December 2015, with bars for rent a fifth lower or higher. Source: S&P Cotality Case-Shiller, BLS and Freddie Mac via FRED; S&P Dow Jones Indices via Yahoo Finance.
Over the essay's own decade, a buyer with 20 per cent down finished slightly ahead of the renter,
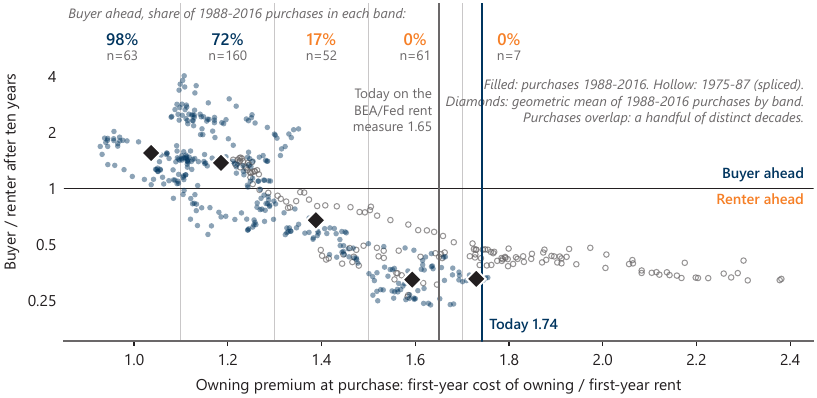
though the answer flips if rents were a fifth lower than assumed. Across every purchase month,
neither side won consistently. What lined up with the outcome was the owning premium: how much more
owning cost than renting an equivalent home at the moment of purchase. In the note's main comparison,
no completed purchase above a premium of 1.5 finished ahead, and expensive purchase dates were
followed by slow home price growth.
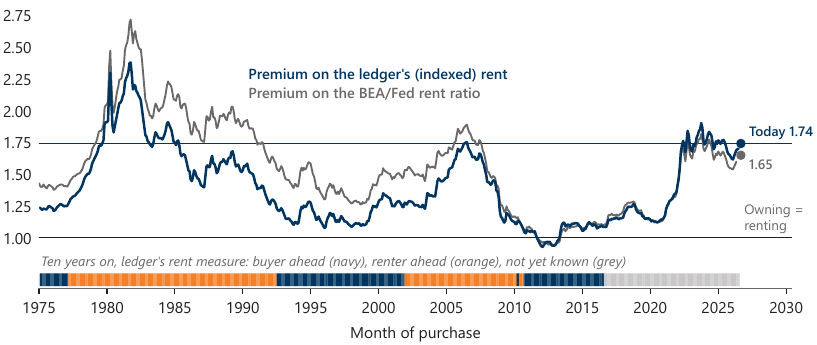
The owning premium is back in its 2004-2007 range: cash cost of owning at purchase divided by the rent on the same home, by month of purchase, on two rent measures. Source: as above, plus the BEA and Federal Reserve Z.1.
Today the premium is 1.65 to 1.74, back where it was from 2004 to 2007, and no completed purchase at
that level has come out ahead. The note is descriptive, before tax and national. It shows when
buying has paid, not whether any one household should buy, and it names the results that would
change its view.