SAM: Strategy Note3 min read

A Fifth of the Gain: Prices Stayed Lower After Productivity Booms Whose Gains Lasted
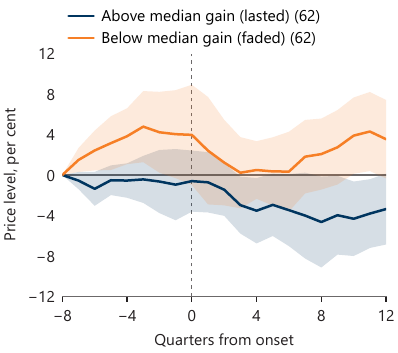
Exhibit 7: relative producer price level around productivity boom onsets, set to zero two years before onset; booms whose productivity gain lasted end about 3.4 per cent lower, booms whose gain faded about 3.5 per cent higher

Hopes that artificial intelligence will hold down inflation rest on a simple chain: more output per hour means lower costs, and lower costs mean lower prices. A recent post from the Federal Reserve Bank of St. Louis looks at American industries since 2006 and finds that relative producer price inflation dips after an industry’s productivity booms.

This note rebuilds that result from the same public data and then asks what the dip adds up to. Read as a price level rather than an inflation rate, much of it undoes a rise that came before the boom. Many booms are recoveries from slumps. Measured from two years before onset, the average boom leaves relative prices about where they started three years later.
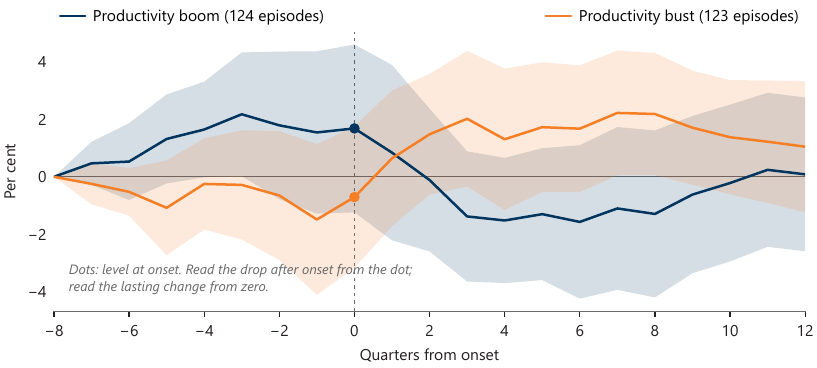
Measured from two years before, the price level ends close to where it started: relative producer price level around productivity booms and busts, per cent, set to zero two years before onset. Source: Federal Reserve Bank of Chicago QILP; BLS producer price indexes via FRED.
What holds up is a proportion. Across industries, over windows of three years or more, relative prices have moved about a fifth as far as relative productivity, in the opposite direction. On average, prices stayed lower after the booms whose productivity gains lasted, by about that fifth. Nearly half of the booms with a complete record left no lasting gain at all.

The proportion varies, and the variation is a warning against leaning on any single number. Among the booms whose gains lasted, relative prices fell by about half the gain in commodity industries and by about a quarter in other manufacturing. Those figures rest on a few dozen episodes and move a long way when any one industry is dropped. Service industries at first look like an exception, with almost no price decline. That is largely one industry, air transportation. Set it aside and services look much like the rest.
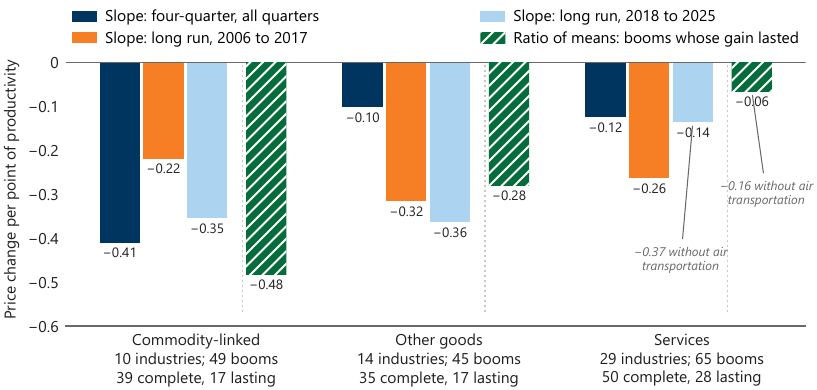
Steepest in commodities by quarter, broad in the long run; the lasting-boom ratios rest on few industries: points of relative price change per point of relative productivity, by industry group. Source: Federal Reserve Bank of Chicago QILP; BLS producer price indexes via FRED.
The note is descriptive. It cannot say how much of the fifth is a measurement artifact, because the productivity data are deflated with the same price indexes. It says nothing about aggregate inflation. Read it for the exhibits and for the three results that would change its view.

Document

Method: Descriptive analysisID: sam_006Download the PDF

  • productivity
  • inflation
  • industries
  • descriptive