The Broadening Premium: Sectoral Inflation Synchronization and the Persistence of Aggregate Price Shocks
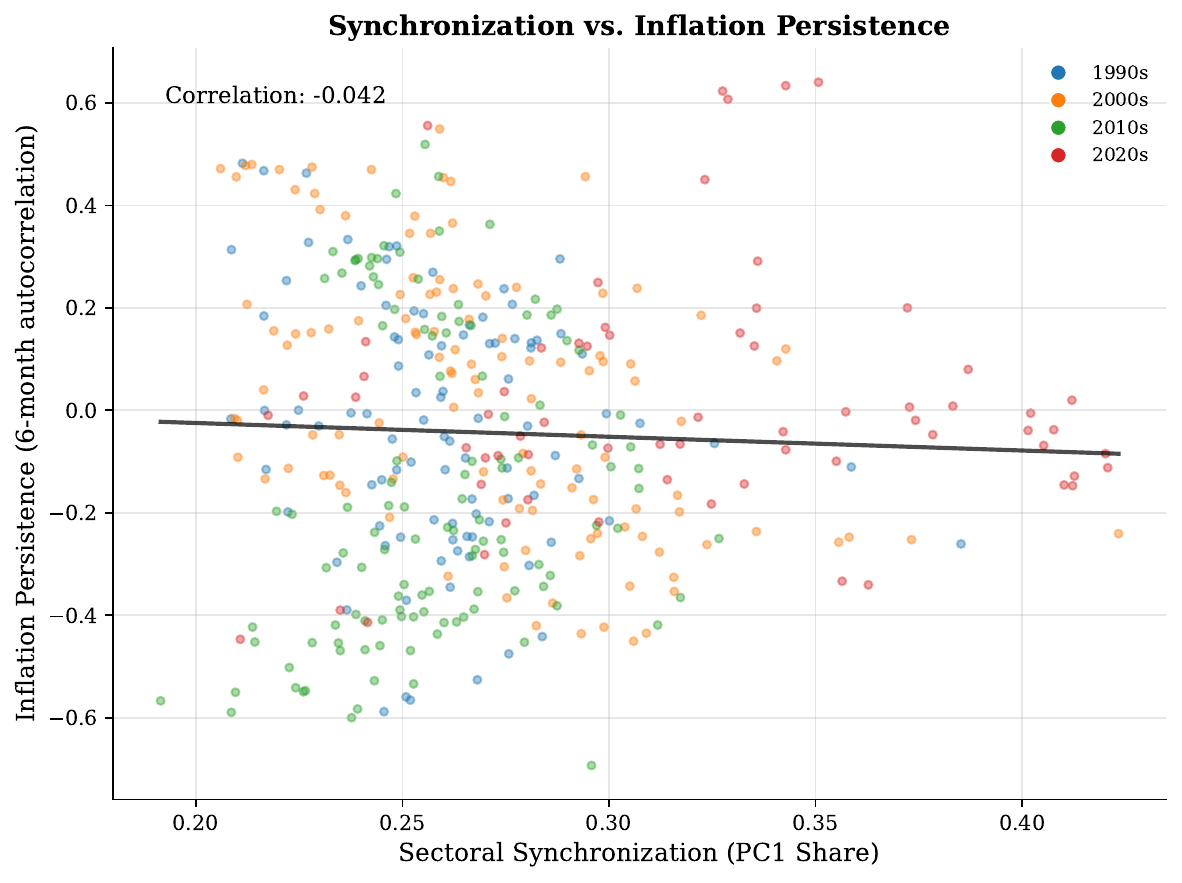
Everyone watched the level of inflation in 2021 and 2022. This paper argues we should have been watching its width. When price increases are confined to a few categories, a spike tends to burn itself out; when they run across the whole consumption basket at once, aggregate inflation starts to behave differently: it lingers, and it resists the usual medicine. The paper calls this the broadening premium, and it builds a real-time measure of it from the same public CPI data everyone already has.
Measuring breadth
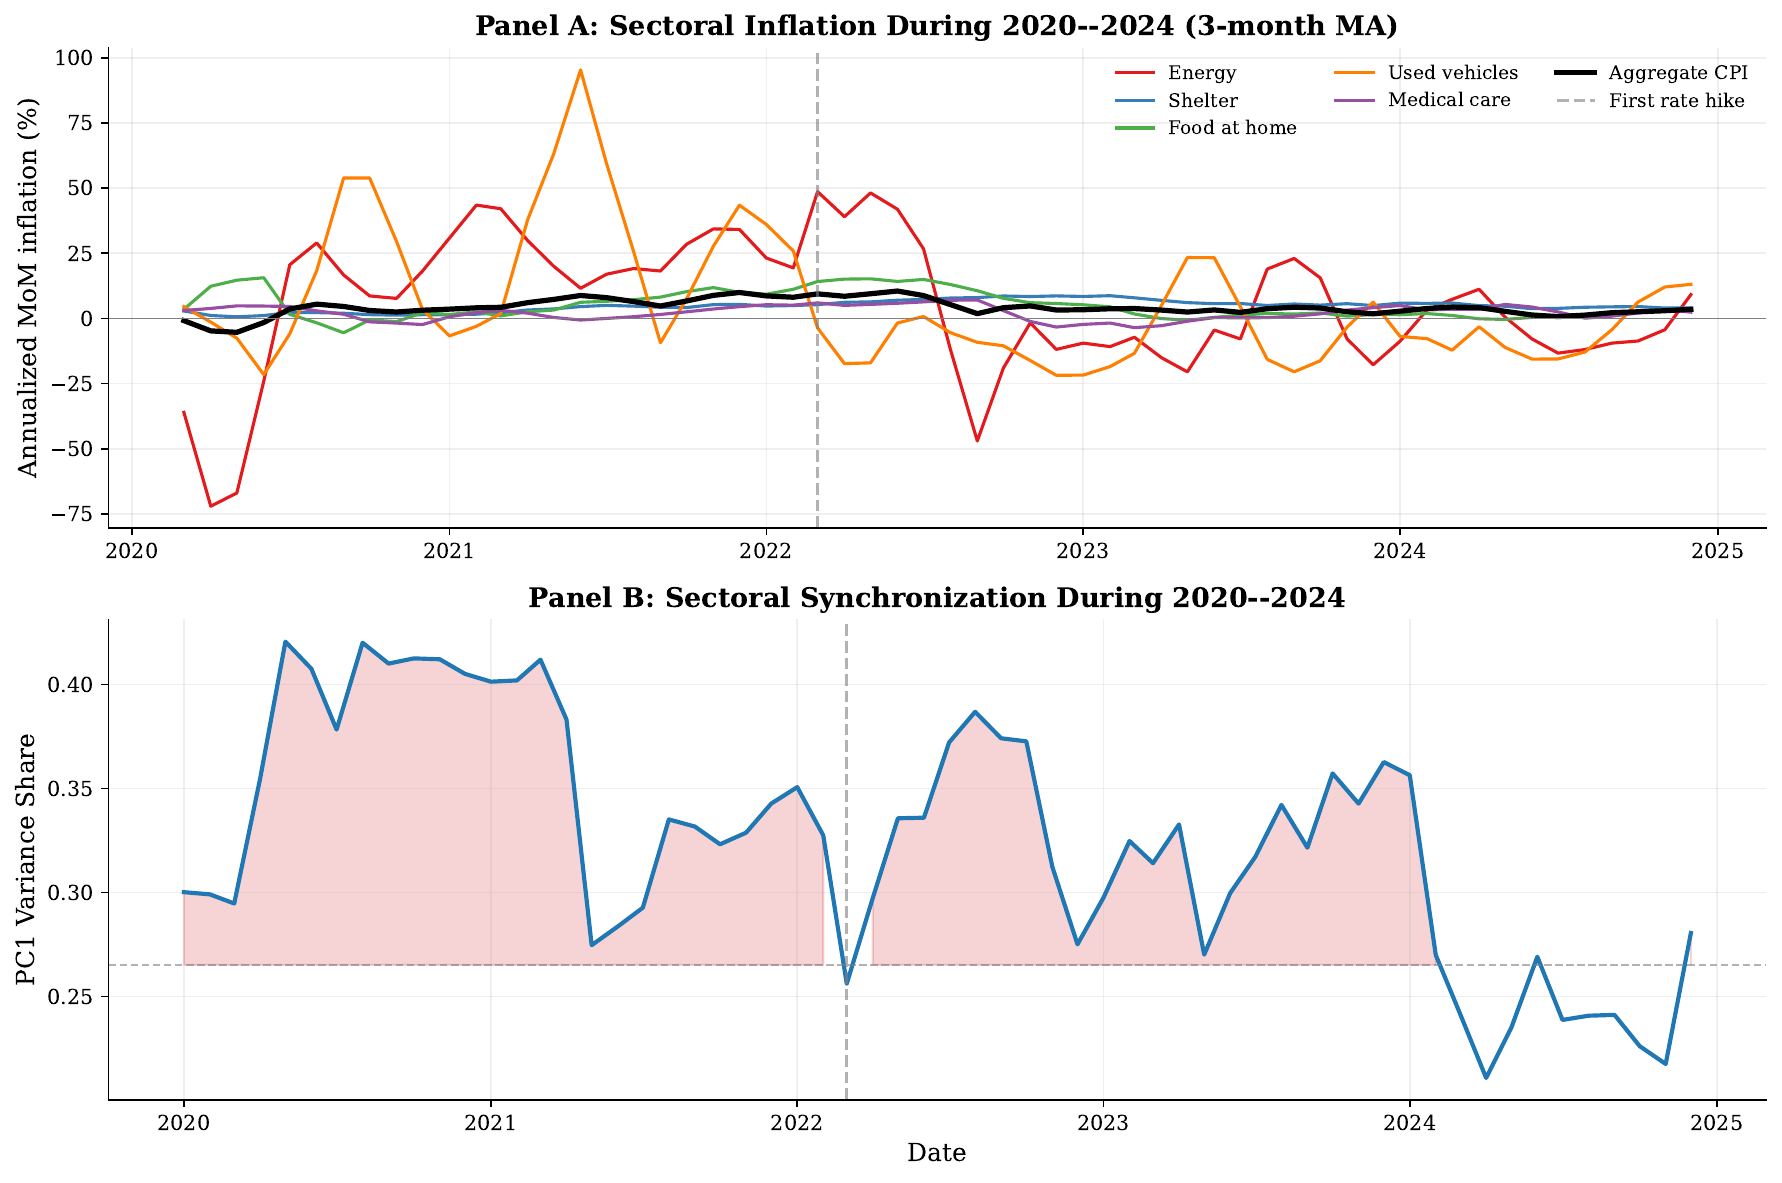
The measure is built from monthly inflation rates for 13 CPI expenditure categories from 1990 to 2024. Each month, a rolling principal-components decomposition asks how much of the variation across those 13 sector inflation rates is explained by one common factor. That first-principal-component variance share is the synchronization index: low when energy or used cars are doing their own thing, high when everything moves together. The hero chart shows the three views at once: the raw sector series, the synchronization index against its 0.265 median, and cross-sector dispersion. The pandemic era stands out immediately, with synchronization holding above 0.40 in 2020 and 2021, the highest sustained readings in the sample.
What breadth does to policy
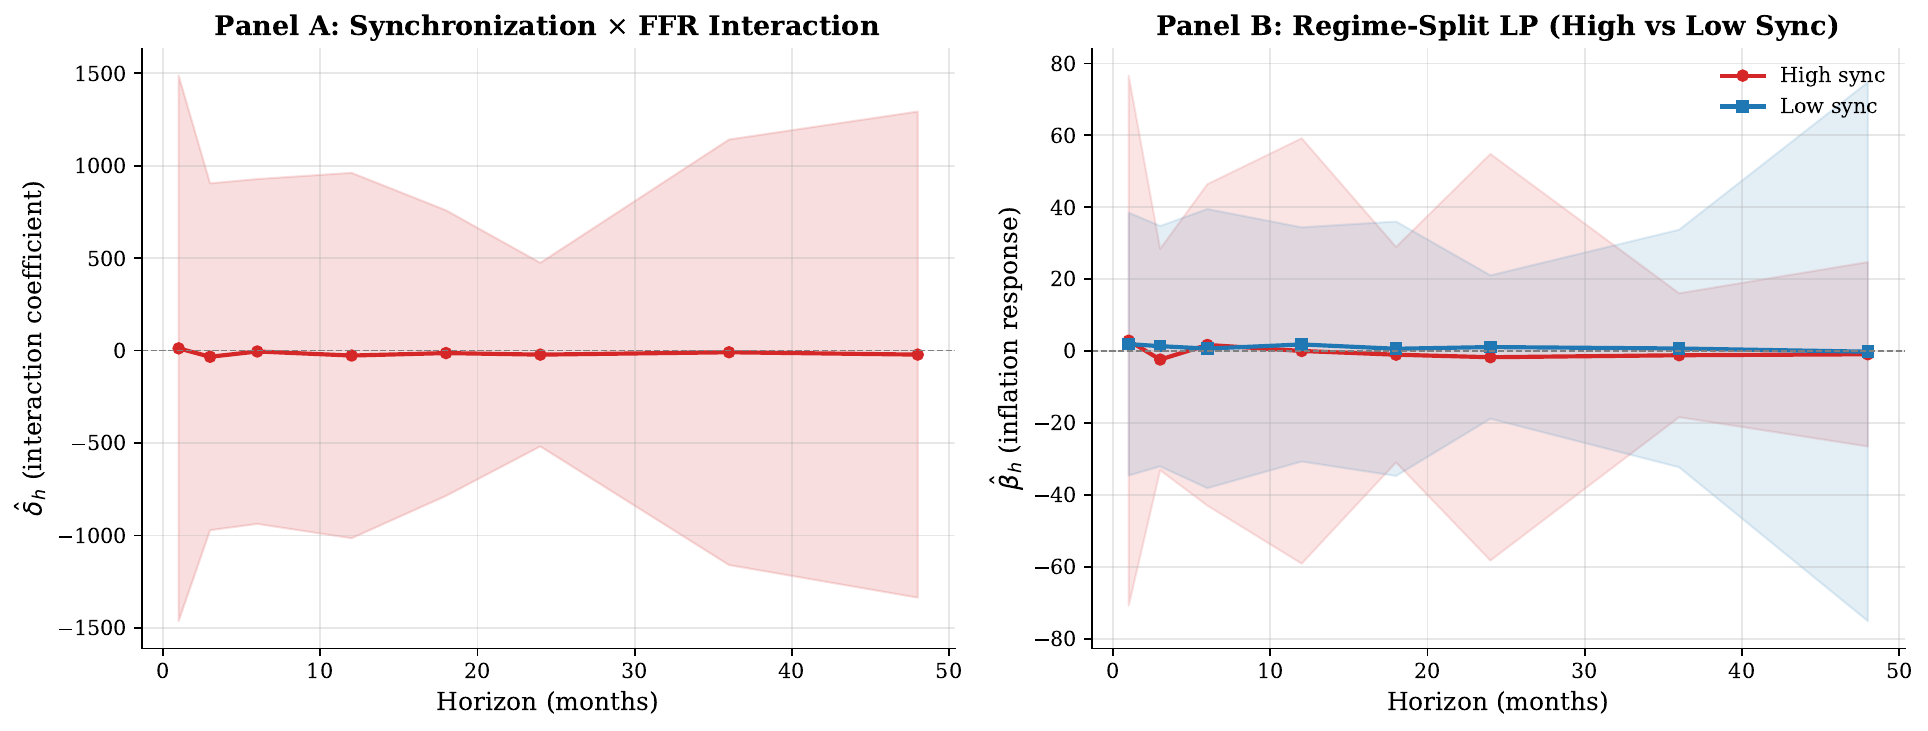
The empirical test runs local projections of future inflation on federal funds rate changes, interacted with the synchronization index. The interaction coefficient is negative at every horizon from 12 to 48 months: the same rate change is associated with a weaker, slower inflation reversal when inflation is broad than when it is narrow.
Why the pattern makes sense
A calibrated multi-sector New Keynesian Phillips Curve model with heterogeneous Calvo pricing supplies the mechanism. Sectors share a common cost shock and face their own idiosyncratic ones. When common shocks dominate, sector inflation rates co-move, and aggregate inflation inherits the persistence of the common factor rather than averaging away. At baseline calibration, the common component accounts for 96.4% of aggregate inflation variance. Counterfactuals make the link explicit: doubling the common shock variance pushes synchronization from 0.78 to 0.98 and raises the first-order autocorrelation of aggregate inflation from 0.78 to 0.82. Breadth and persistence are two faces of the same shock structure.
The 2021 to 2024 episode
Run the lens over the recent inflation and the story writes itself. The 2020 spike began as a narrow, energy-and-used-vehicles event; through 2021 it broadened into food, shelter, and services, and the synchronization index stayed pinned in its high regime through the first rate hike of March 2022 and well beyond.
What it means
The practical implication fits in one sentence: central banks should monitor the cross-sectional breadth of inflation, not just its level, because a broadening episode signals a more persistent one and may warrant a more aggressive response. The index here is cheap to compute in real time from published CPI components. The paper is equally clear about limits: identification uses simple funds-rate changes rather than high-frequency policy surprises, and the model abstracts from sector-specific persistence and strategic complementarity. Sharper shock measures and cross-country variation are the natural next steps. The full model derivations, estimation details, and robustness checks are in the paper.